
The answer is a lot–kickers have notably increased their range and accuracy in the past decade.
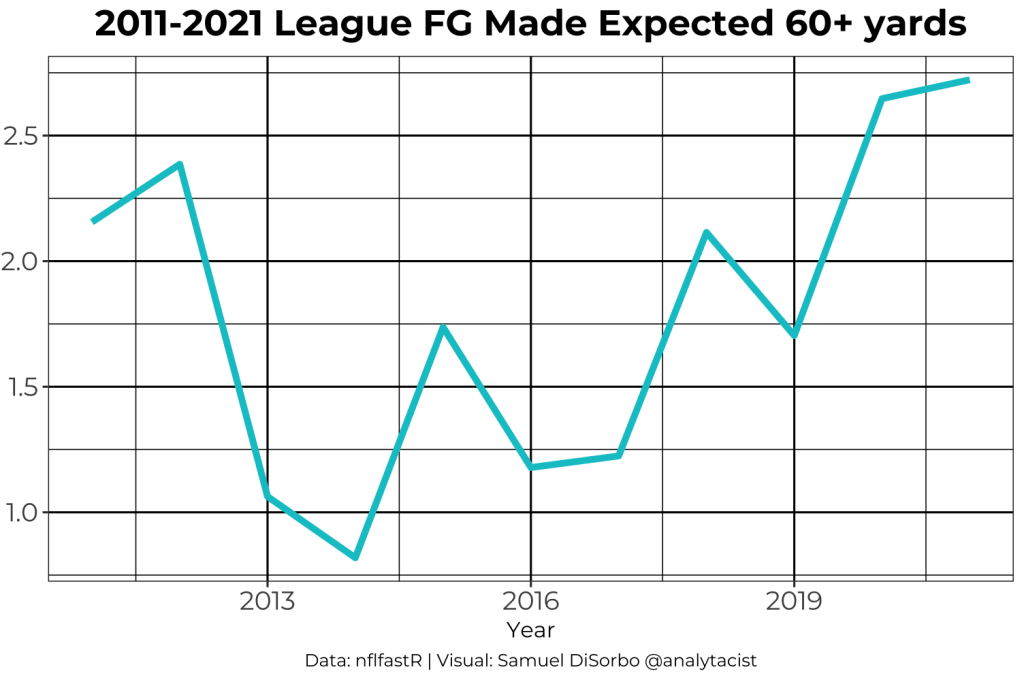
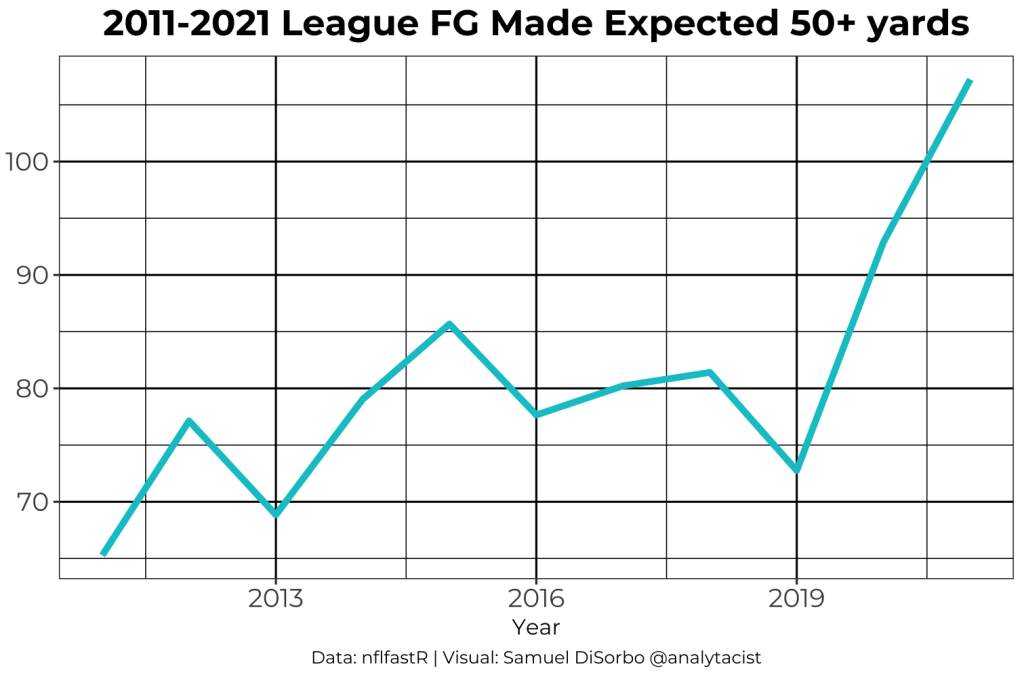
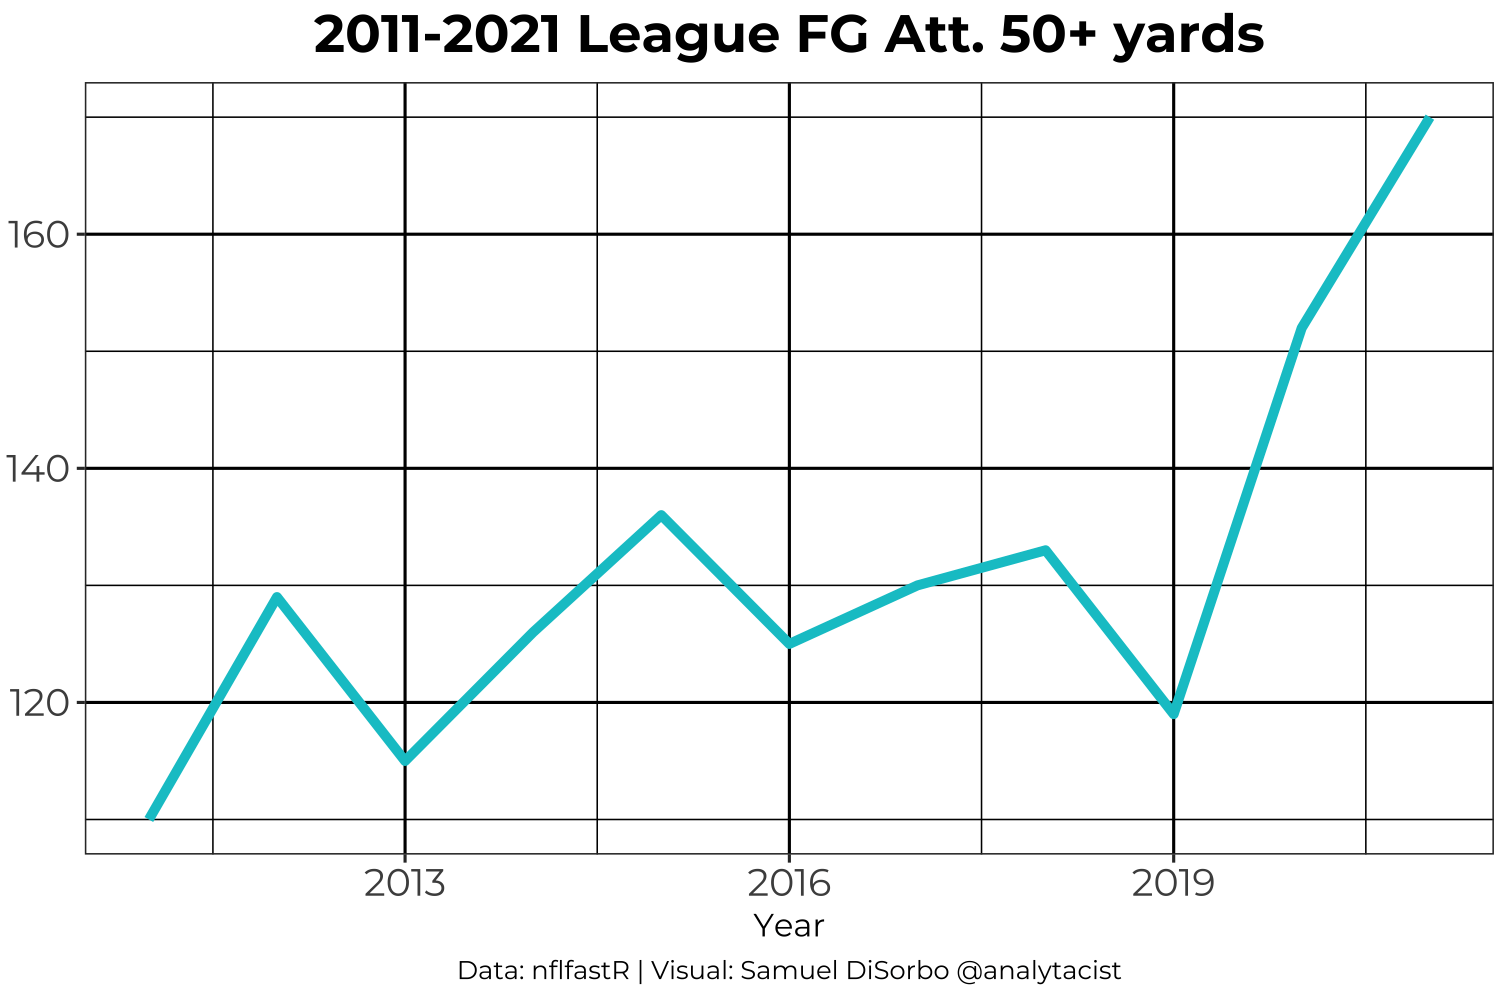
We can see clear-cut evidence of this from the increase in expected made field goals by kickers from each distance. The most noticeable increase is in expected field goals made from 50+ yards–with over 35 more expected field goals in the past 11 years, it is evident that kickers’ ranges have grown (especially since 2019).
The next slideshow shows not only the increased accuracy of kickers, but the increased use of them–teams have been attempting further kicks since 2011, and have been taking more FG chances as well.
It is also interesting to note the drought in 2018 and 2019–much fewer FGs were taken, which might have been a result of poor kicker performance that season.

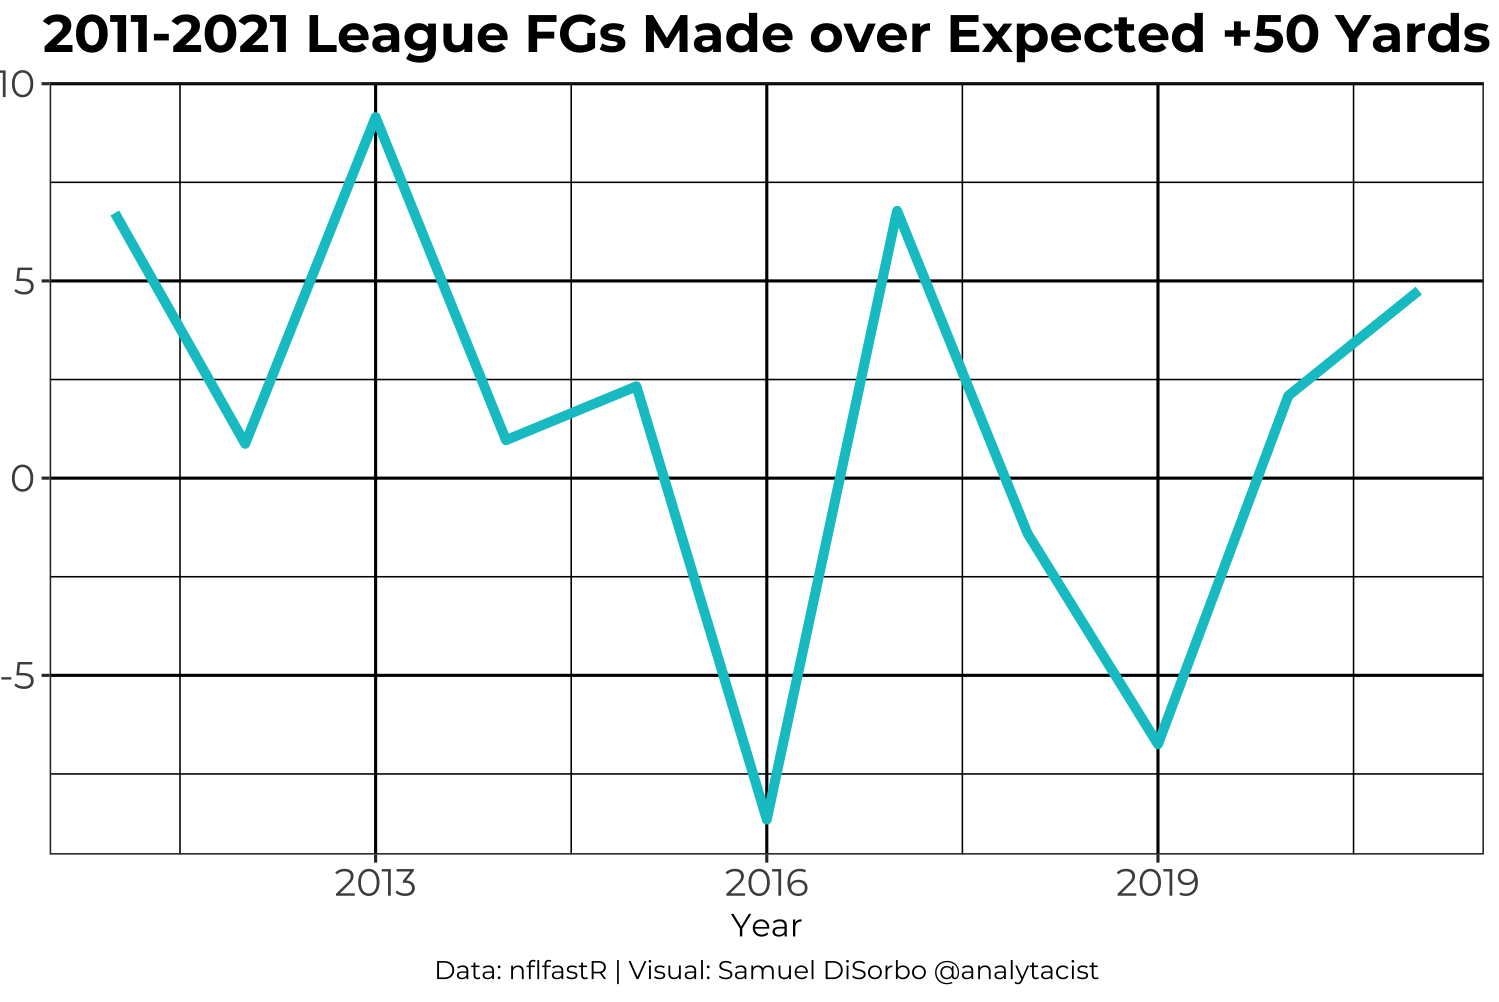
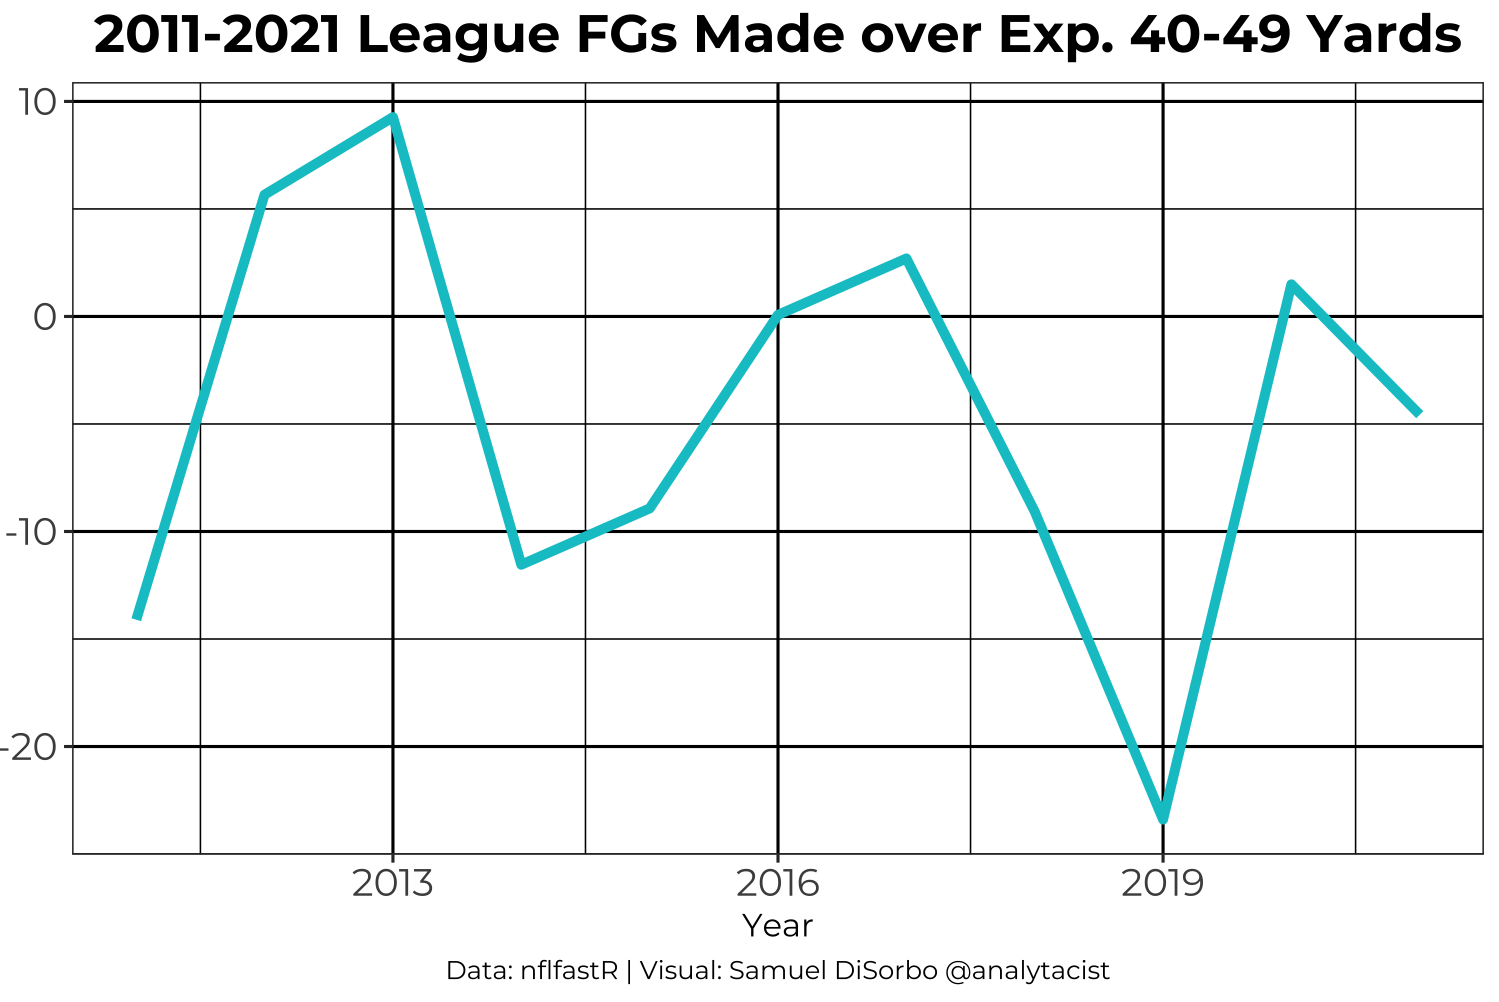
League-wide FGs made over expected has also increased, but at a more volatile pace. This makes sense, however, as the expected field goals for kickers has increased as they have gotten better over the years.


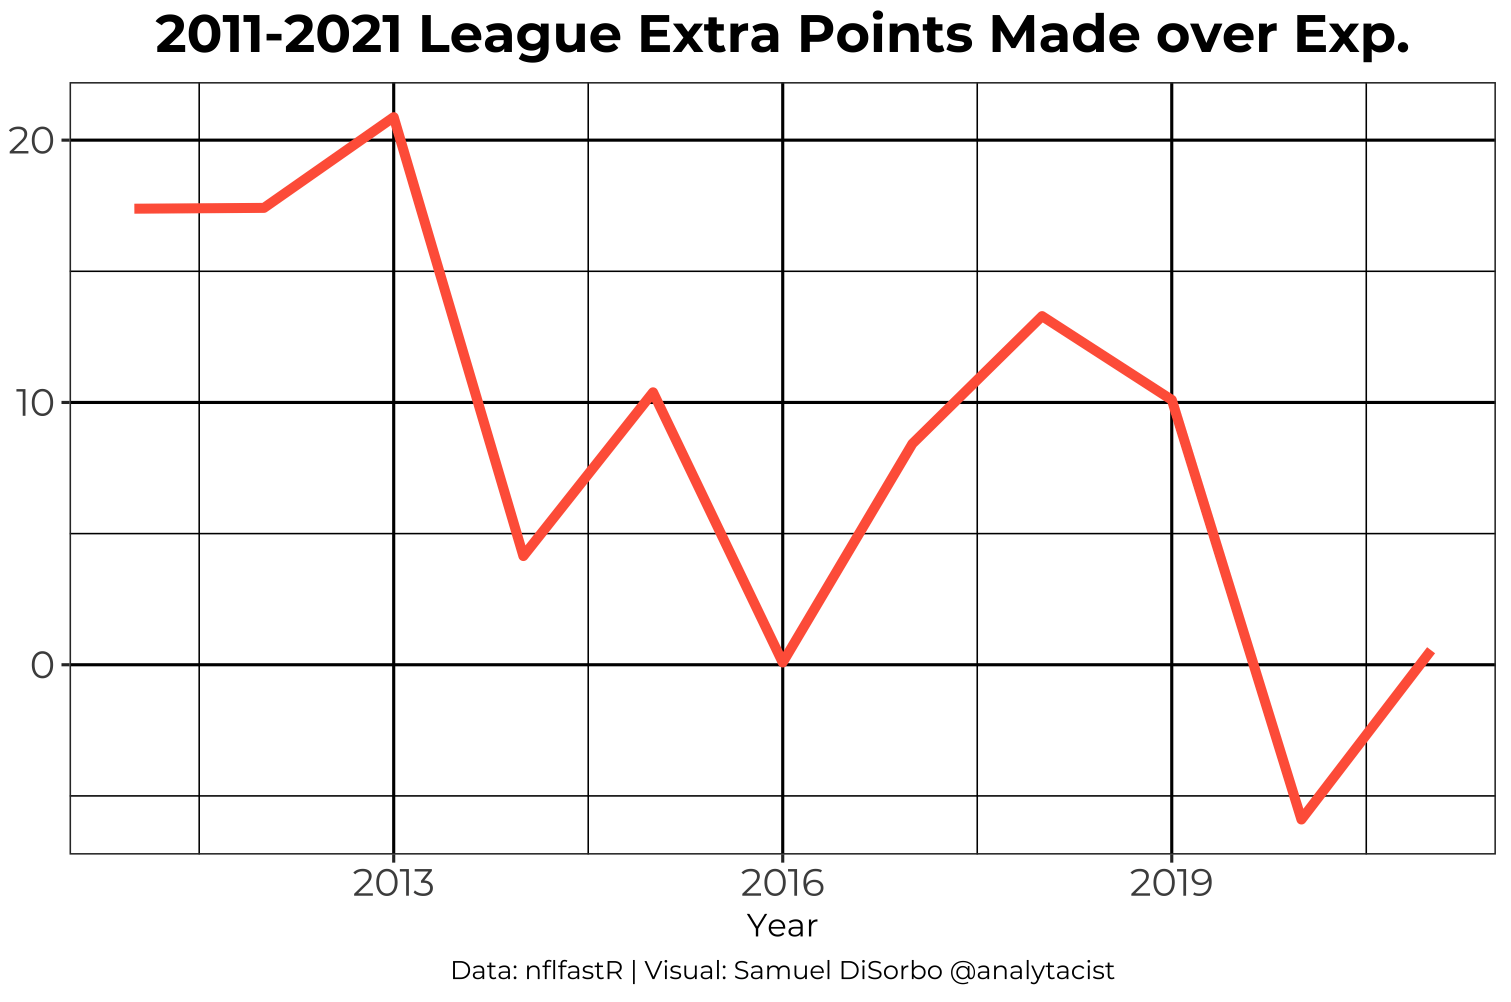
Many NFL fans might be under the impression that kickers are getting worse–this may be because of their decrease in extra point efficiency. Looking at the league-wide extra points made over expected, we see a severe drop-off since 2011. This is no question due to the increase in distance for extra points from 17 yards to 32. Don’t panic, it’s normal for your favorite team’s kicker to miss a few extra points from that distance!
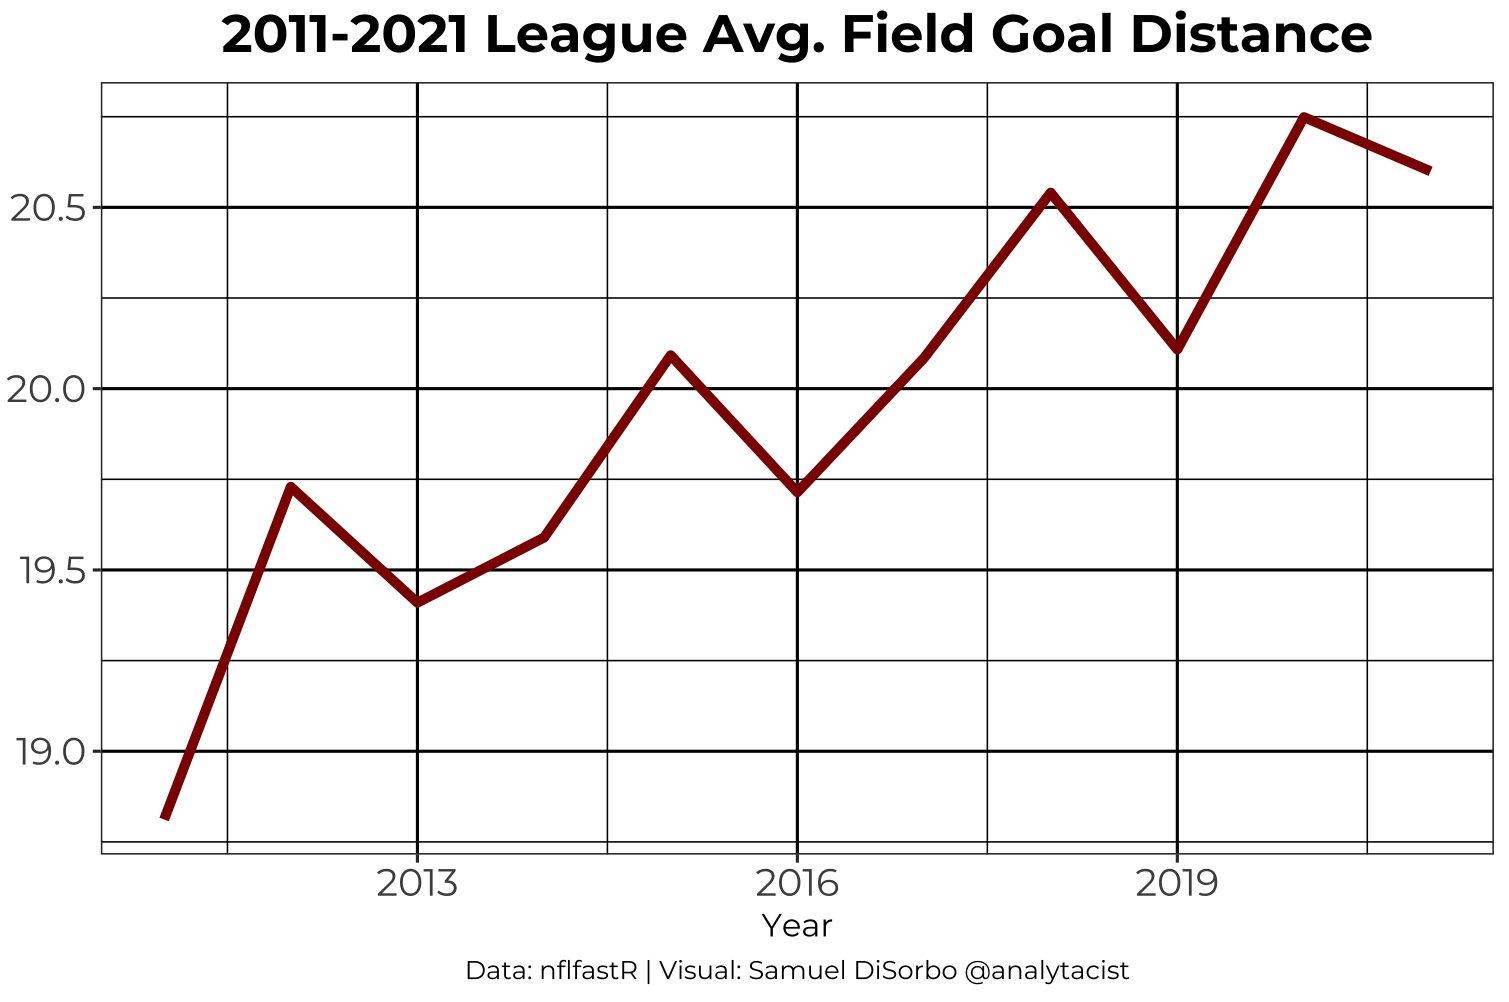
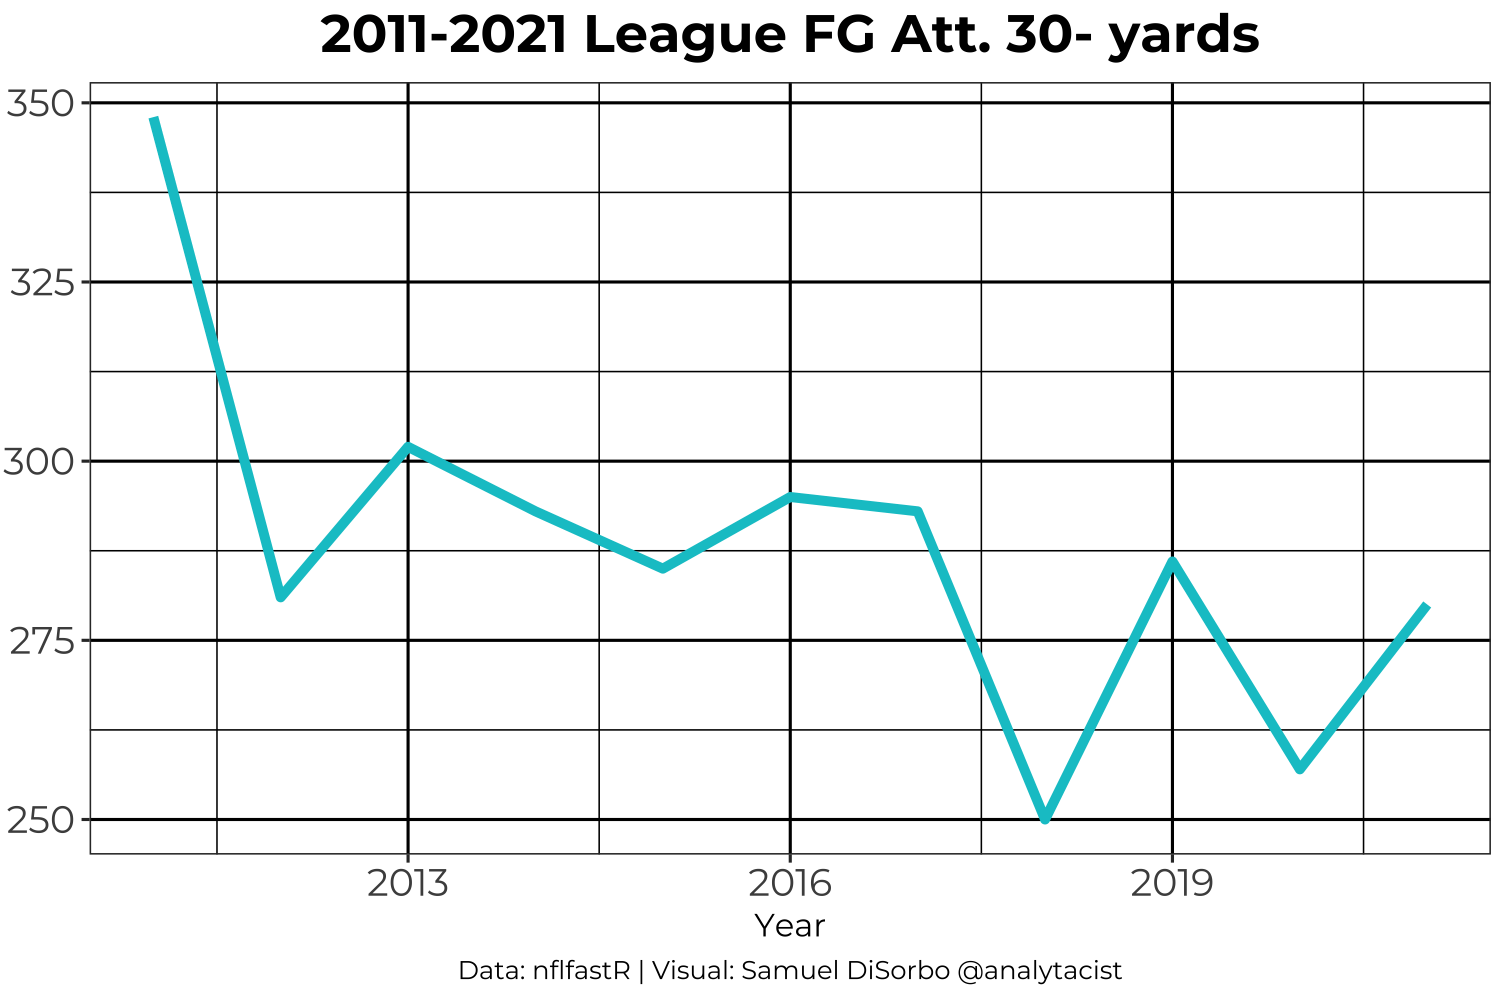
Teams are also attempting a lot more long field goals. This would be due to kickers’ increasing range and accuracy, as well as coaches hesitancy to punt. You’ll also notice a massive drop in FGs attempted from 30 yards and under since 2011. This is no doubt due to teams being more aggressive on fourth down, especially near the red zone as they hawk for points. This phenomenon is explored in greater detail in my previous article Making an NFL Fourth Down Decision Model.
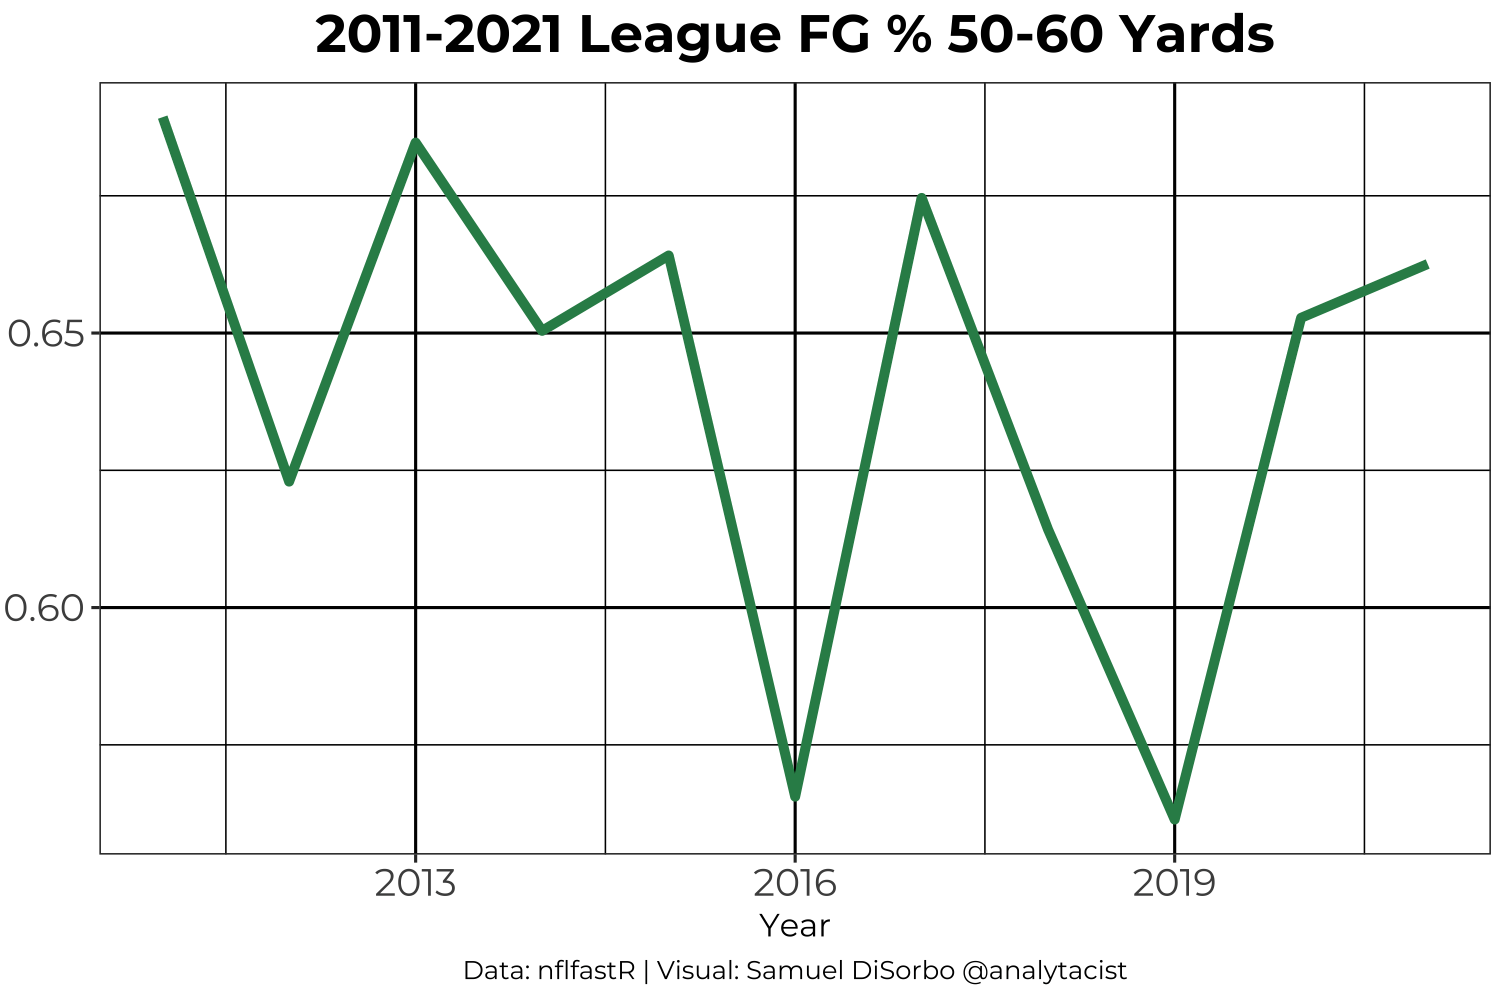
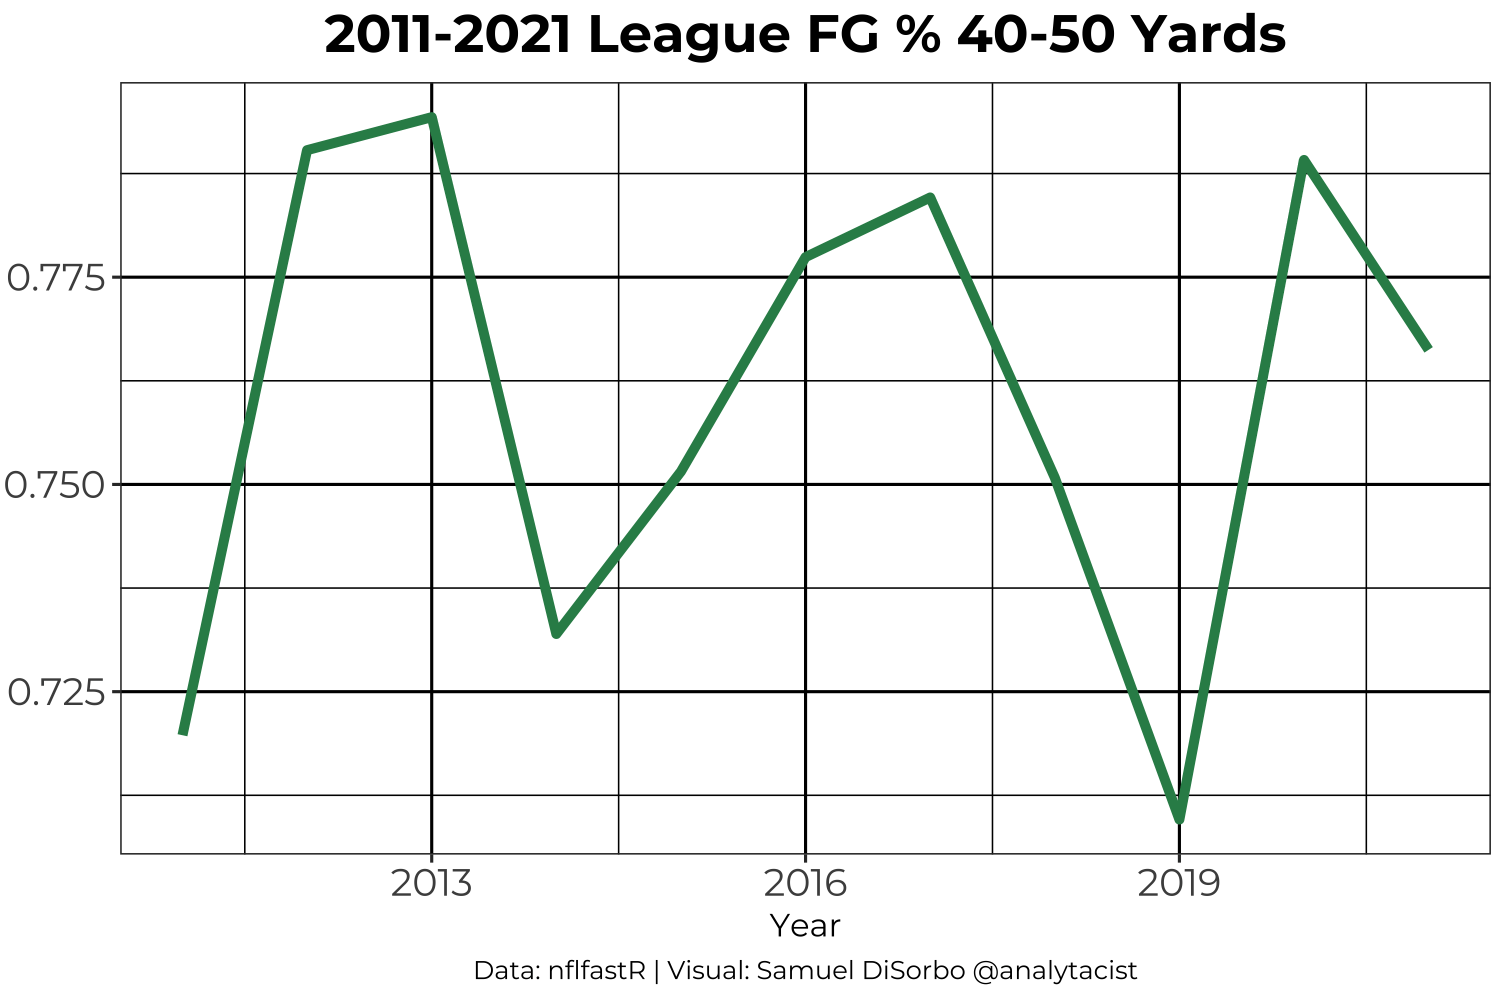
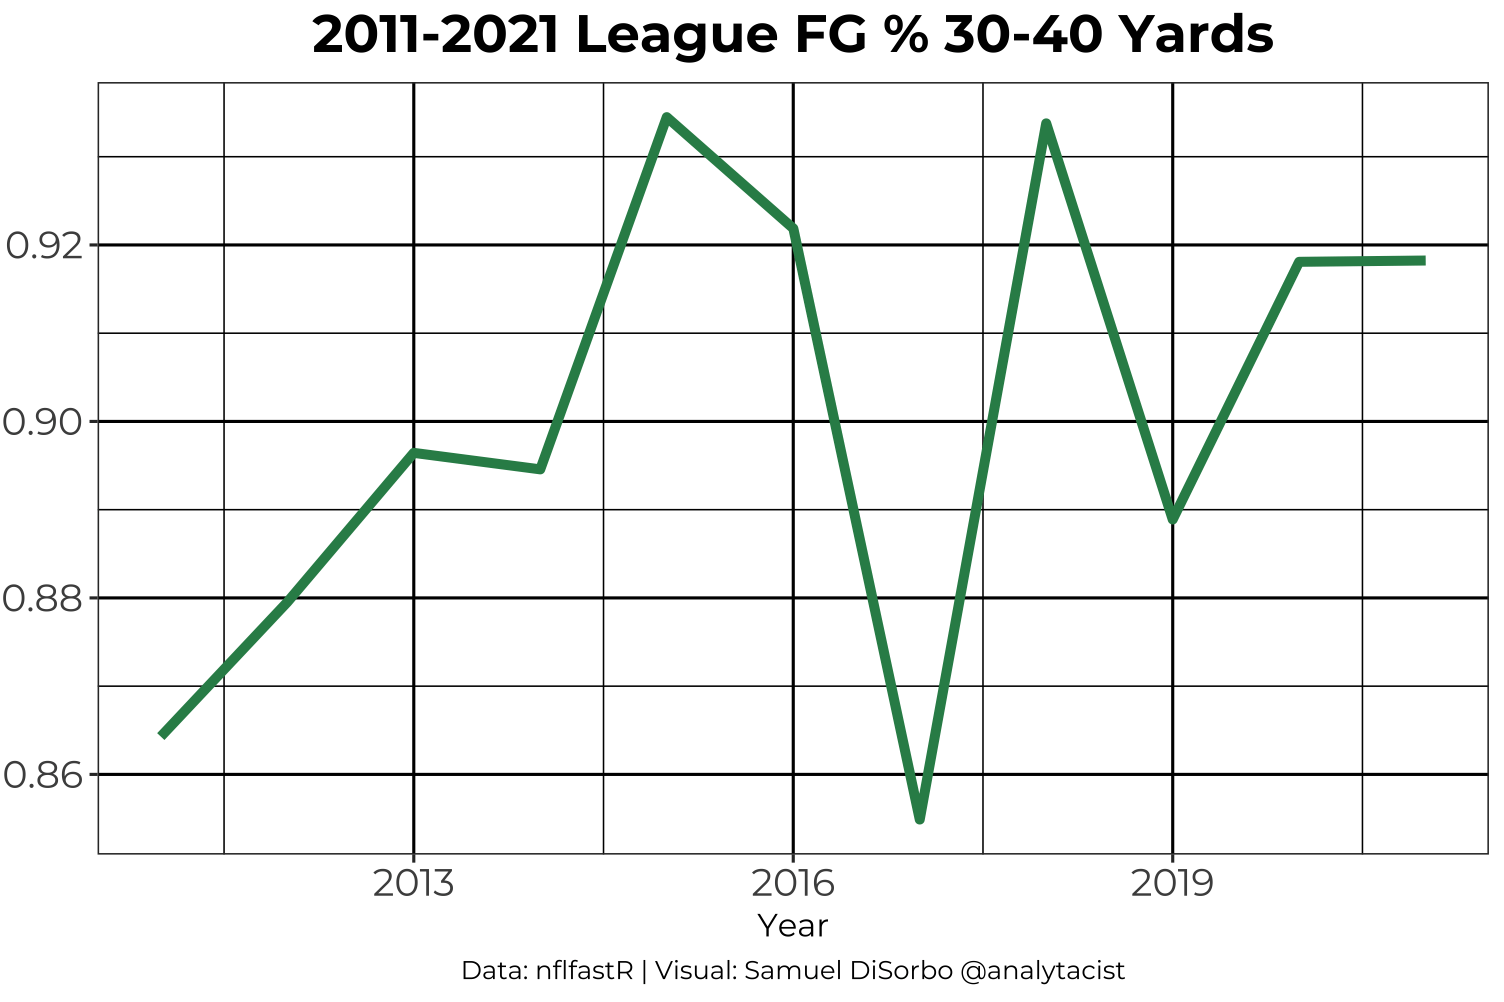
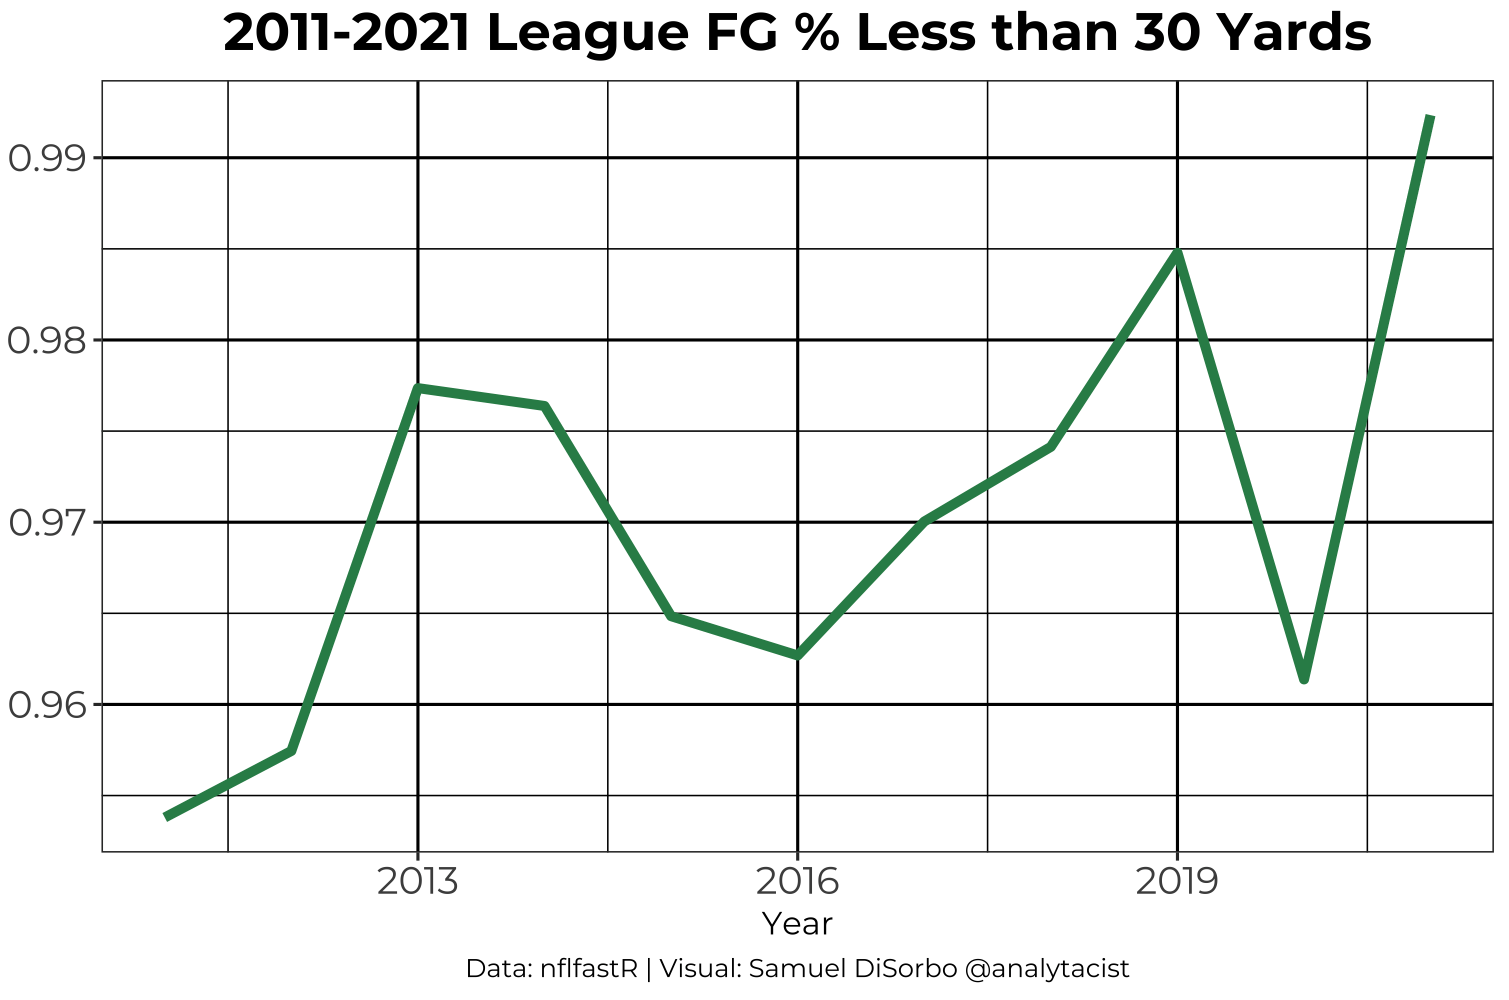
Another look, this time at FG % progressions–Kickers have broken the 50% accuracy barrier from 60+ yards, and have become almost automatic from 40 yards and in.

Below is a density plot showing the distribution of FG distances since 2011.

2011 vs. 2021 FG heat maps are shown below. These are fairly similar, although kickers were better from 40-50 yards out in 2011 surprisingly (we can attribute this to bad luck/variation for the kickers in 2021).

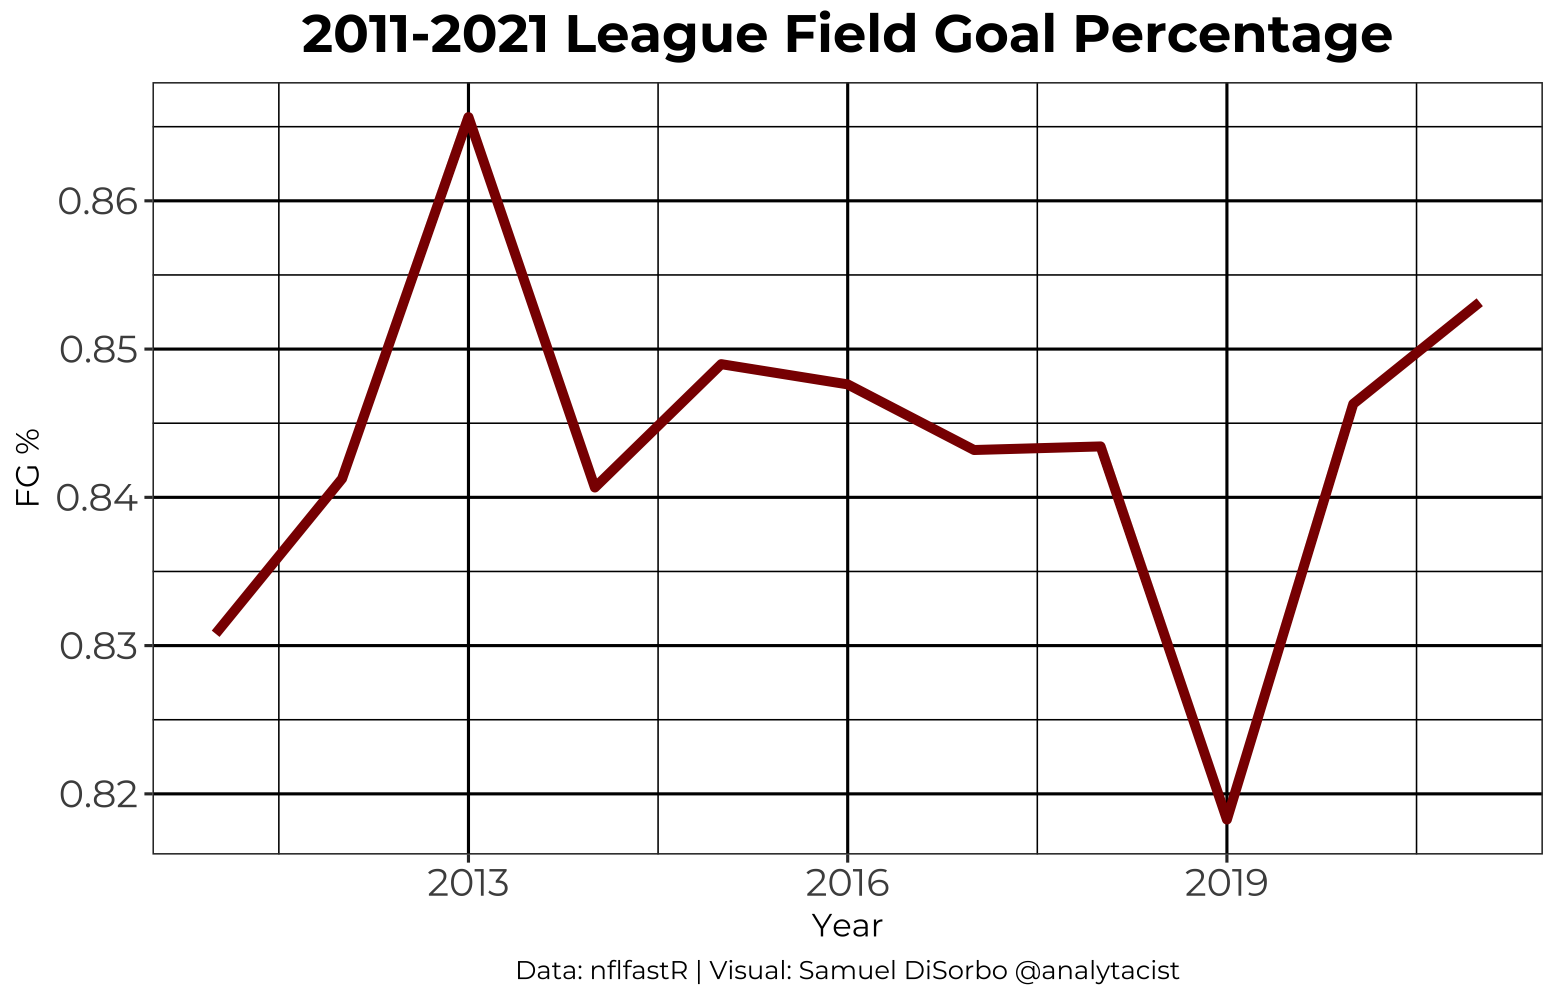
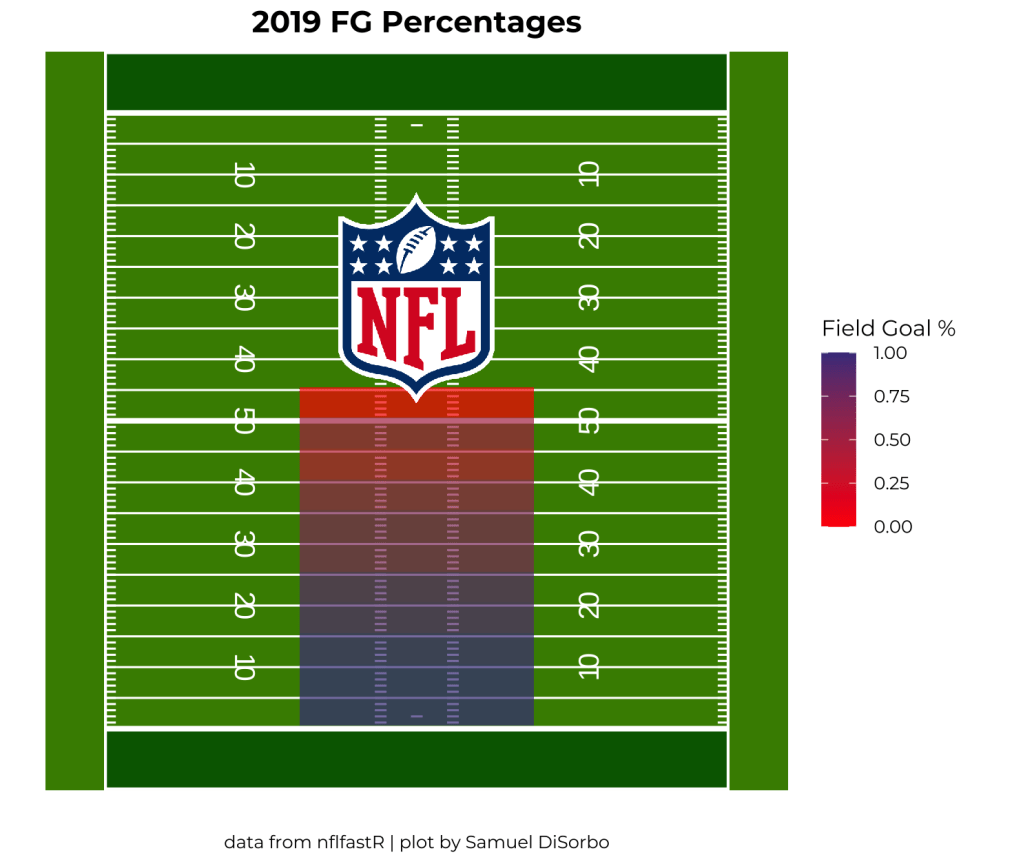
What Happened in 2019?
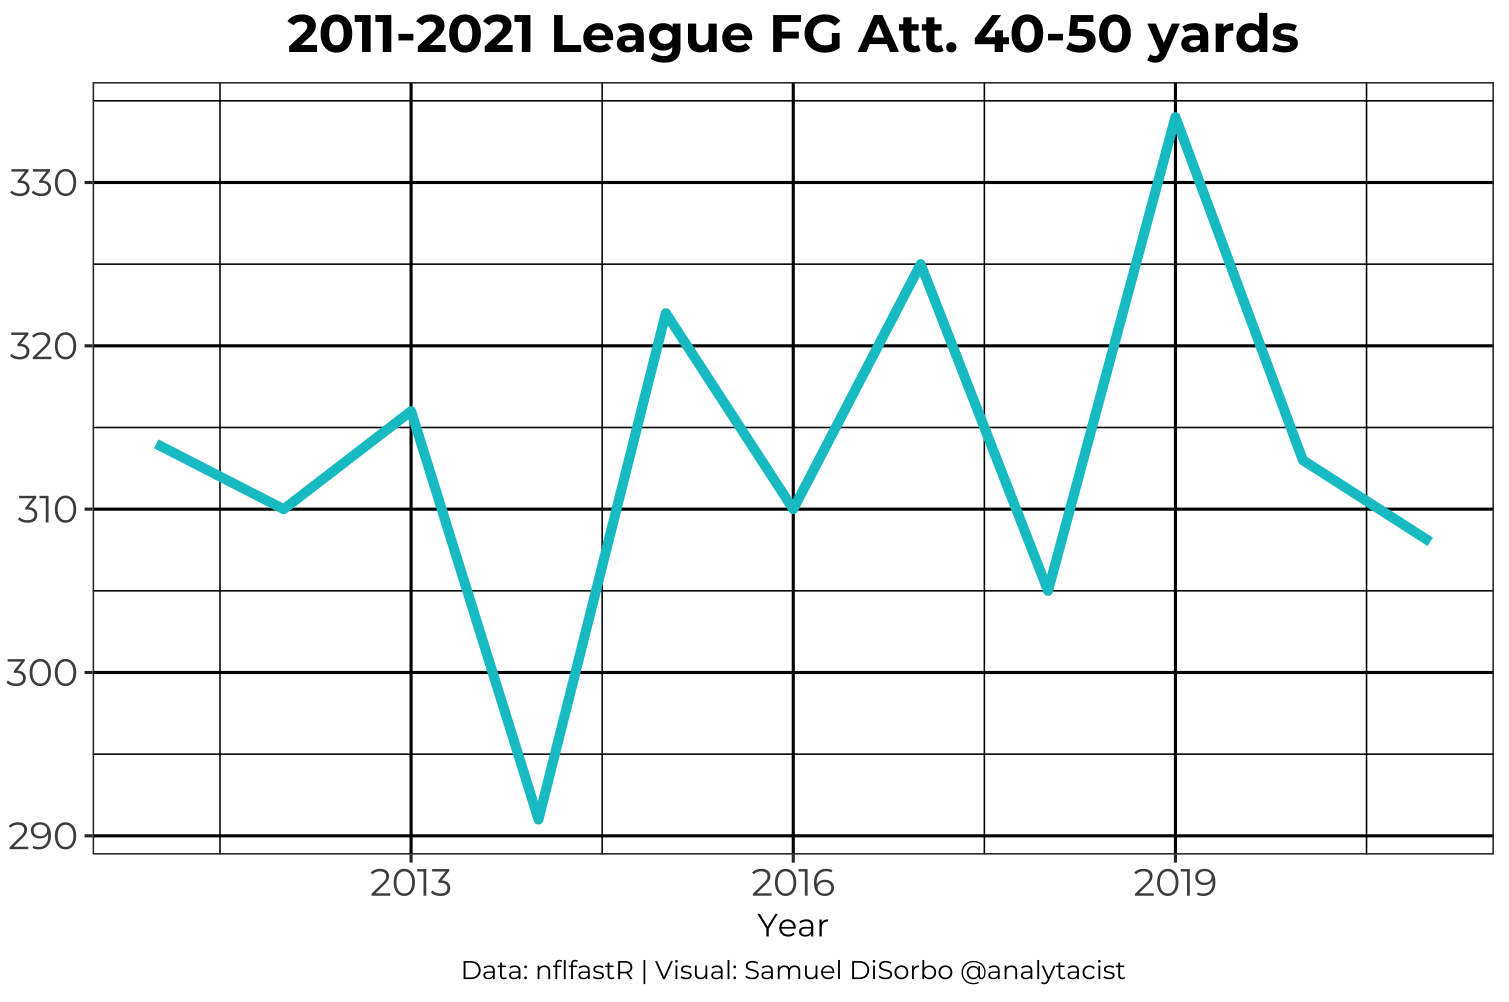
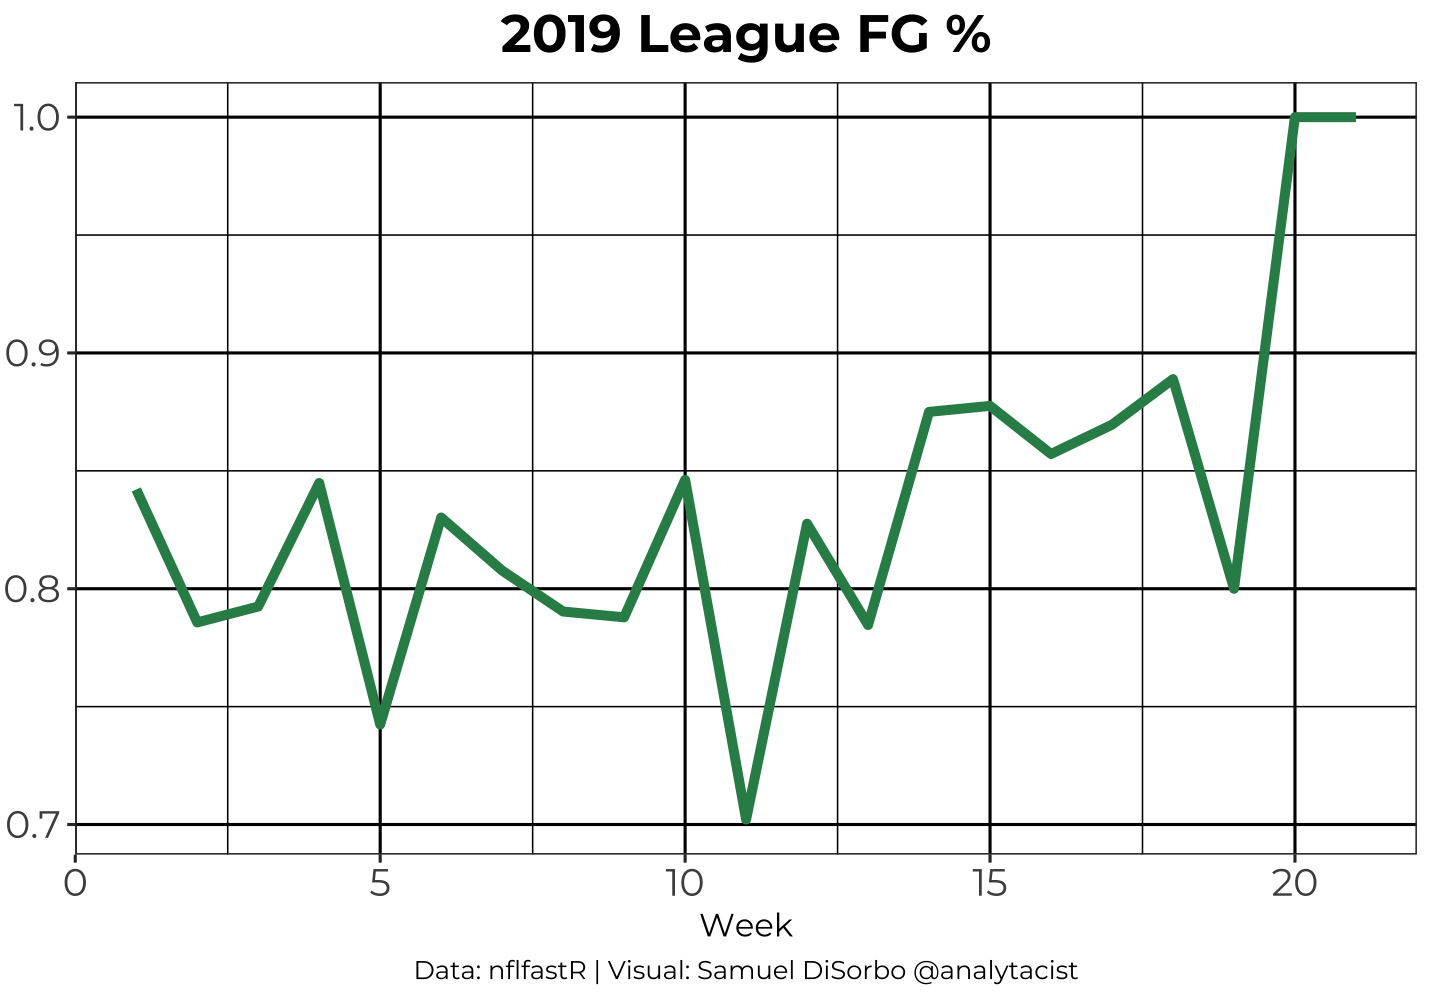
When we look at the numbers for 2019, we can see that only 5 kickers had FG percentages over 90%; Josh Lambo (97.1%), Justin Tucker (96.6%), Chris Boswell (93.5%), Dan Bailey (93.1%), and Mason Crosby (91.7%). One thing we might be able to attribute to kickers’ struggles is the sharp increase in long-mid-range attempts (40-50) yards. Nearly 30 more were taken than the year prior, which could have led to a short adjustment period for kickers. As you’ll see in the progression chart below, it’s evident they started cold and never recovered, with two atrocious weeks really bringing the percentage down. The percentages seem to have grown exceptionally once the playoffs started however, which points to the number of inexperienced kickers mediocre teams were trying out. Once those teams were eliminated, the real kickers were able to go to work. 14 of top 32 kickers that season in total attempts were under 25, and all of them but 5 (Butker, Lutz, Gonzalez, Seibert, and Too) had FG percentages under 85%.
That’s all for this article, as always feel free to reach out to me on Twitter @analytacist if you have any questions!
