Fourth down. One of NFL head coaches’ most critical decisions–do you take the points and settle for a field goal? Do you risk giving your opponent stellar field position and go for it? Do you take the conservative route and punt, trying to pin your opponent against their goal line? Coaches must consider these crucial questions every time their team faces a dreaded fourth down–some of them make stronger choices than others in these situations, putting their teams in better positions to win games–they have to make exceptional decisions, as a mistake in a high-stakes play like this could cost them the game.
In this article I will be breaking down my newest model, STALEY, which stands for Separately Trained (Boosted) Algorithm (predicting) Leveraged Expected Yield. STALEY is a fourth down decision model which has a number of useful functions:
- Generate decision analysis for any fourth down scenario
- Determine a team’s expected WPA (win percentage added) and EPA (expected points added) for each possible decision
- Analyze NFL fourth-down trends
- Analyze team/coach fourth down decision-making efficiencies
This is a long article, so if you want to skip around, the sections are linked below:
Making the Model
To make this model, I used an extreme gradient boosting algorithm, which helped me predict the outcomes of each decision on any given fourth-down. xGBoost is a type of machine learning algorithm that can quickly correct its own mistakes as it is being trained. STALEY is actually run on three separate xGBoost models–let me explain.
I trained this model on all NFL fourth-down occurrences (58,883) from 2006 to 2020. For each fourth down, I gathered a variety of stats to help create the model–the main ones are; yard-line, time remaining, yards to go, timeouts remaining, score differential, expected points, and win percentage. I then input these stats into three separate models–one for field goals on fourth-downs, one for punts on fourth-downs, and one for ‘go for it’ attempts on fourth downs. With an algorithm for each option, when given a scenario, STALEY can leverage each separate model to determine which decision will give the highest predicted yield, in the form of win percentage added (WPA).
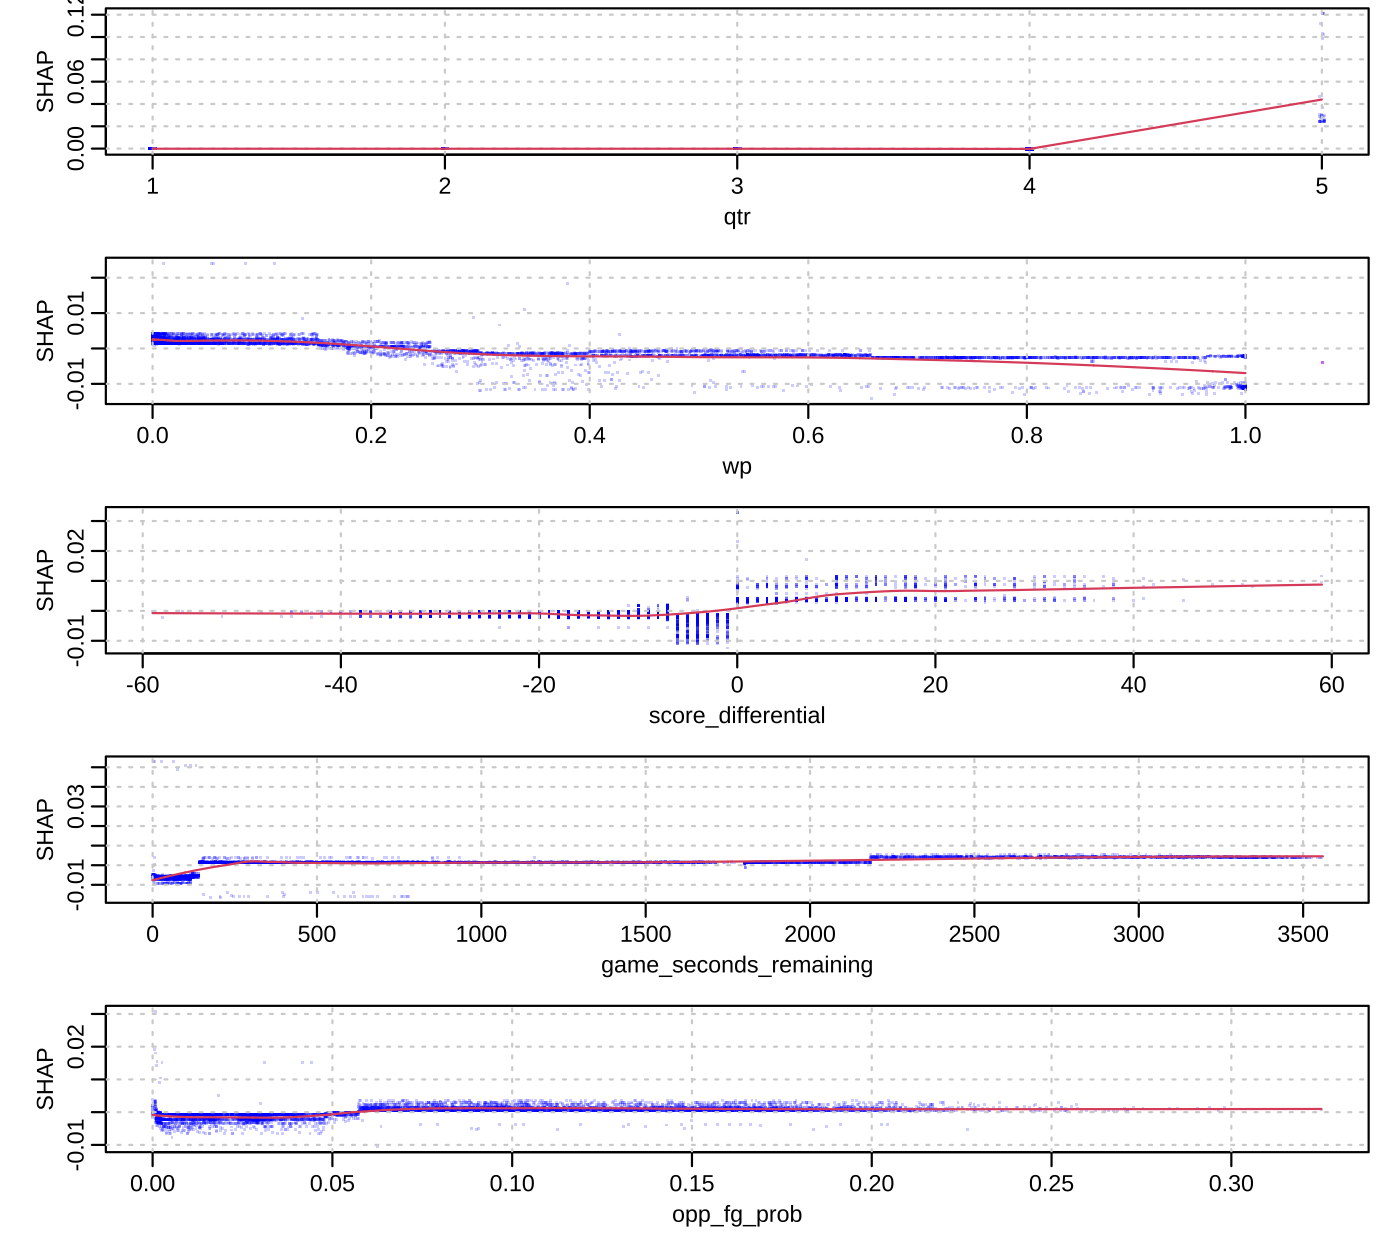
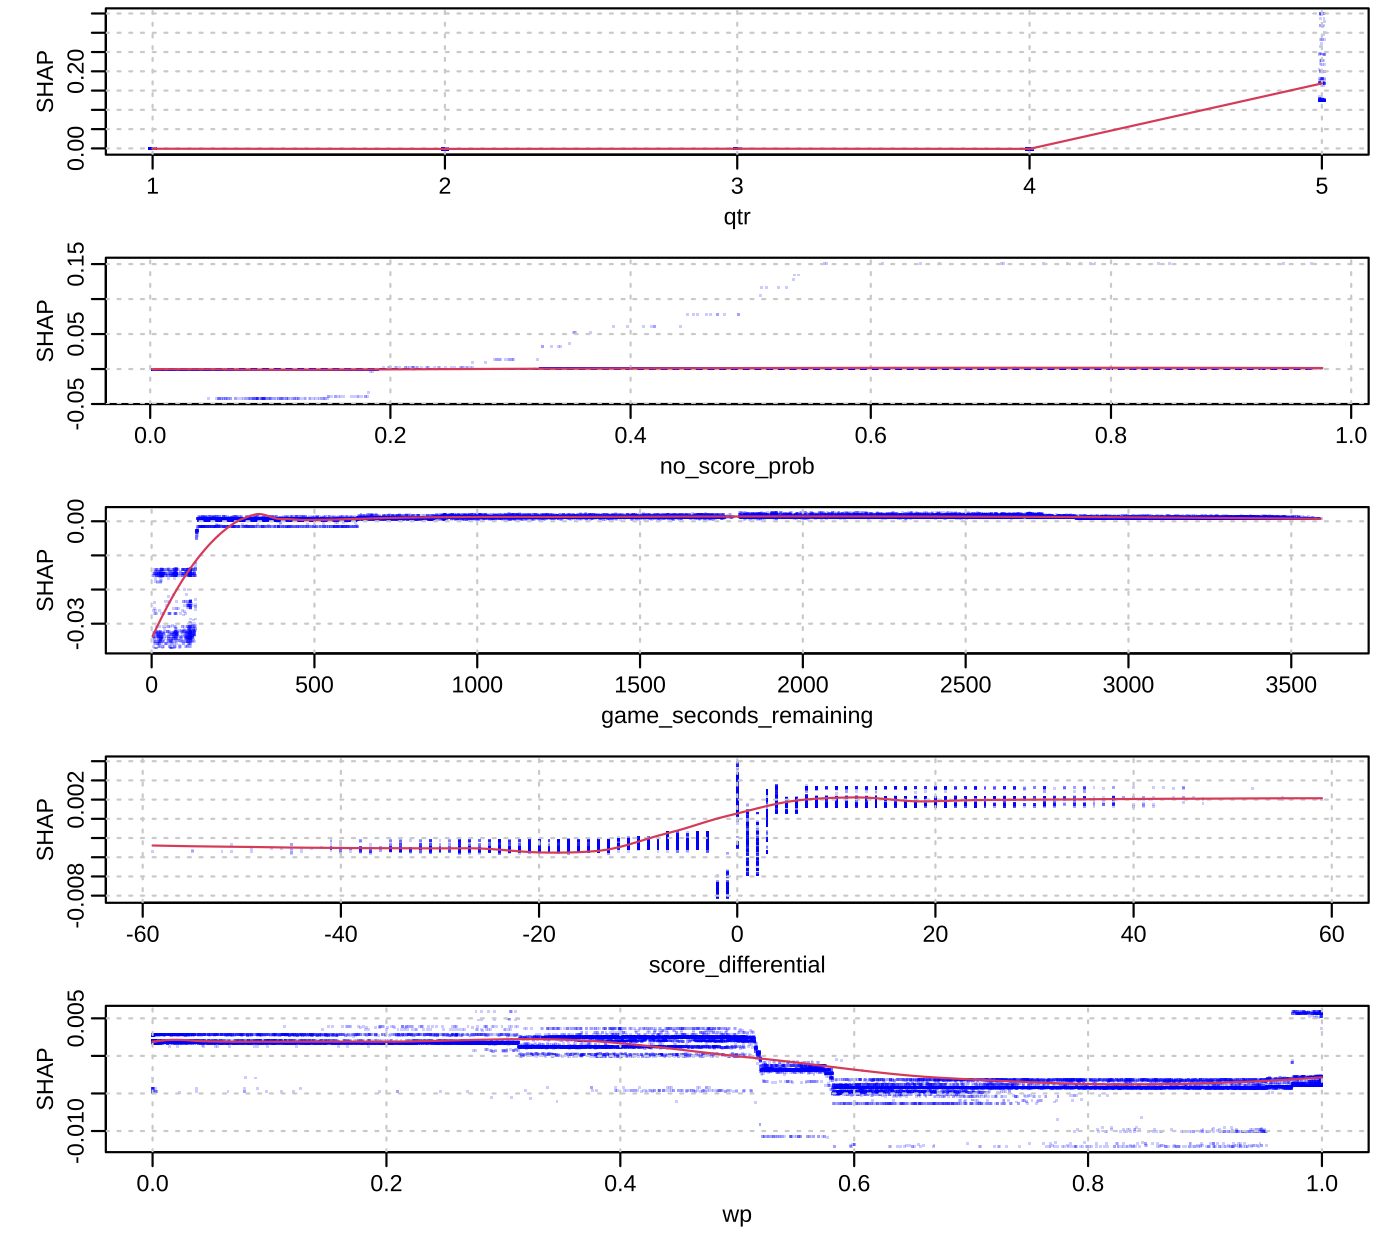
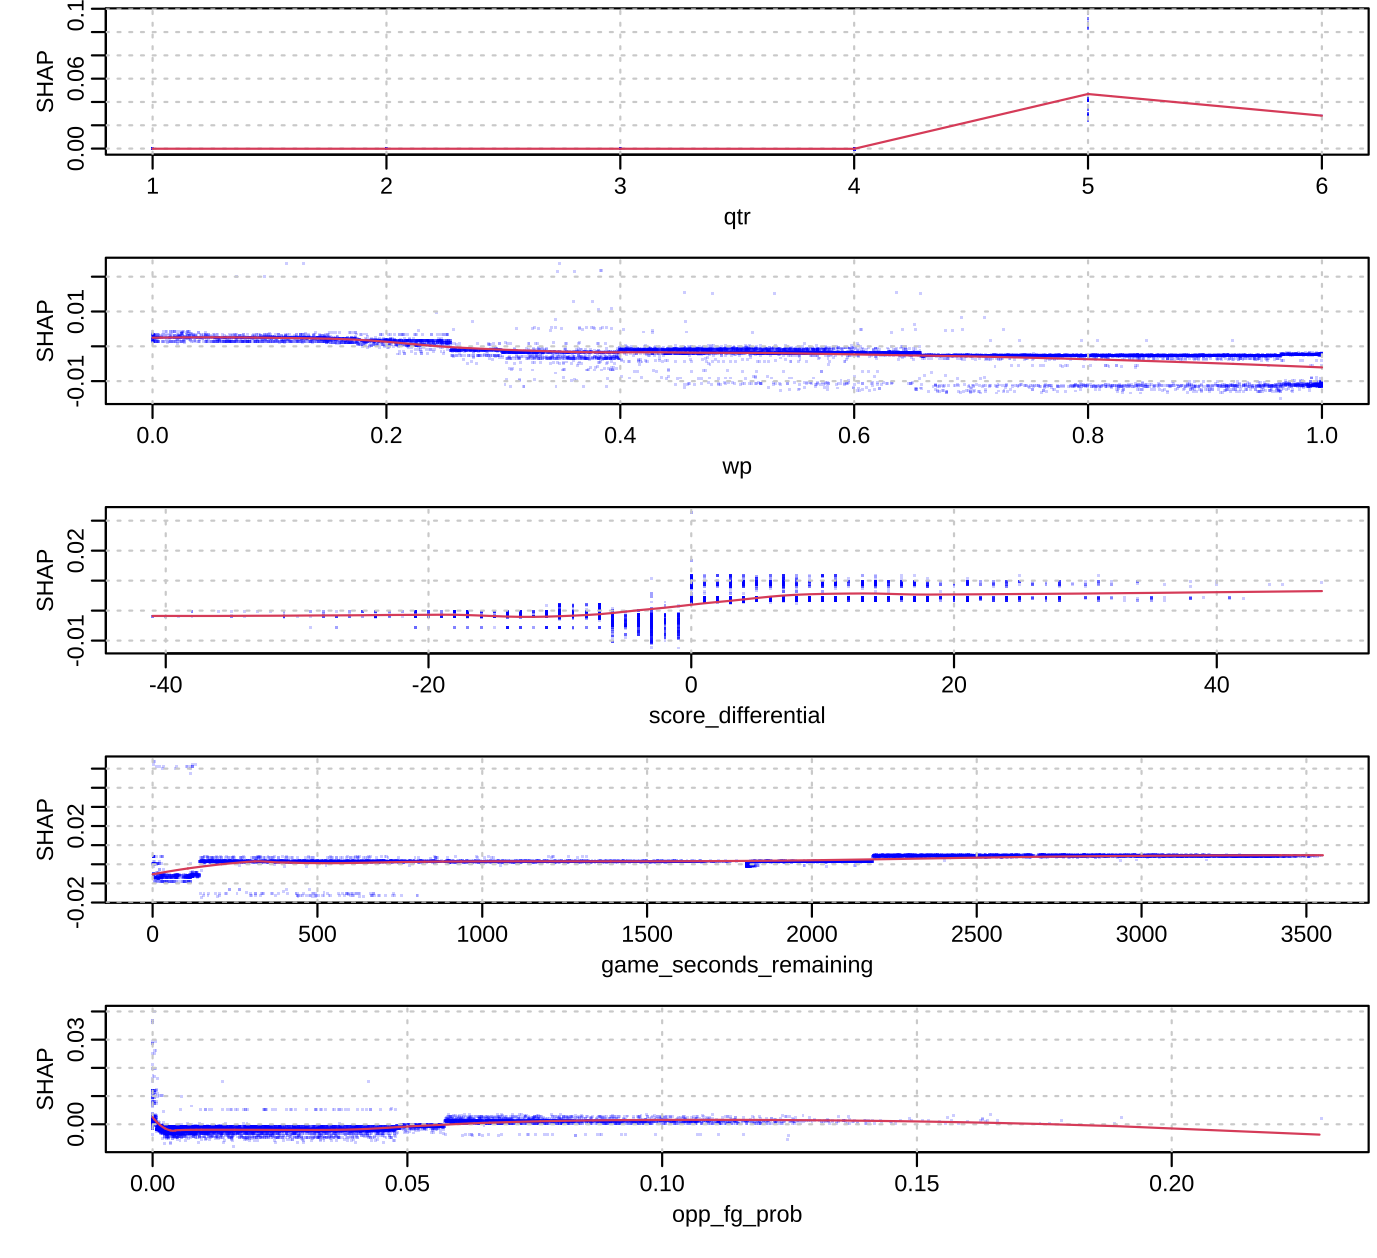
Below we can see which metrics were most influential for each piece of the model–you’ll notice they are mostly the same stats but in varying order. The first slide shows metrics for the ‘go for it’ sector of the model, the second for the punt sector, and the third for the FG sector. It is no surprise that quarter trumps all, as the later in the game we get, the more effect a fourth down decision can have on the game.
Let’s take STALEY for a spin, shall we?
It’s fourth down and 1, we have the ball on the 8 yard-line. There are 6 minutes and 20 seconds left in the game, we have one timeout remaining, and the opponent has all three. We trail by three points. What should we do? Take the chip-shot field goal and tie the game, or take a gamble and go for it, knowing that if you succeed you will likely score a TD to take the lead?
Let’s see what STALEY says.
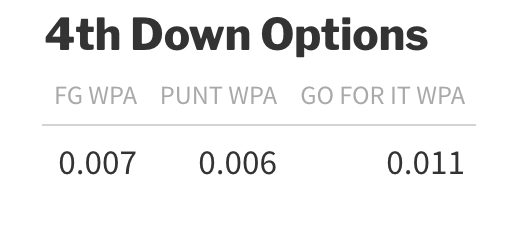
Judging by STALEY’s output, it says the largest win percentage we can expect to add to our team’s total is 1.1%, in the case that we go for it. There are a couple of other takeaways we get from this example.
1. STALEY is a computer-run algorithm
As you can notice, STALEY output a value for WPA on the basis that we punt. While ideally, STALEY would recognize that punting the ball from the 8 yard-line is inconceivable, it is not human, and therefore cannot make these rational judgments. The good news, however, is that STALEY can recognize that punting would be the worst option here.
2. STALEY is not always one-sided
While STALEY points out that going for it is the best option, it doesn’t fail to realize that kicking a field goal is not a bad option. This is helpful, for in cases where STALEY’s inability to think rationally gets in its way, a human’s ability to do so will allow for the person using the model to intuitively come to make the right decision.
Let’s try another example. Let’s imagine that this time it is a tie game and it’s fourth and 10 on the opponent’s 30 yard-line. 10 seconds remain in the game. What does STALEY suggest we do?
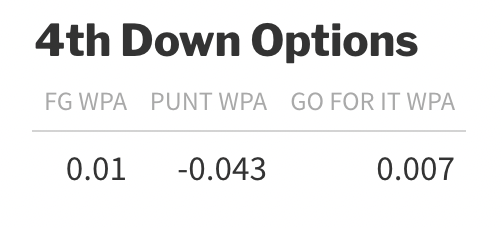
STALEY says that the best option is to kick the field as it is expected to add 1.0% to our win probability. It is able to recognize that if we kick and make the field goal, we will have the highest chance to win the game.
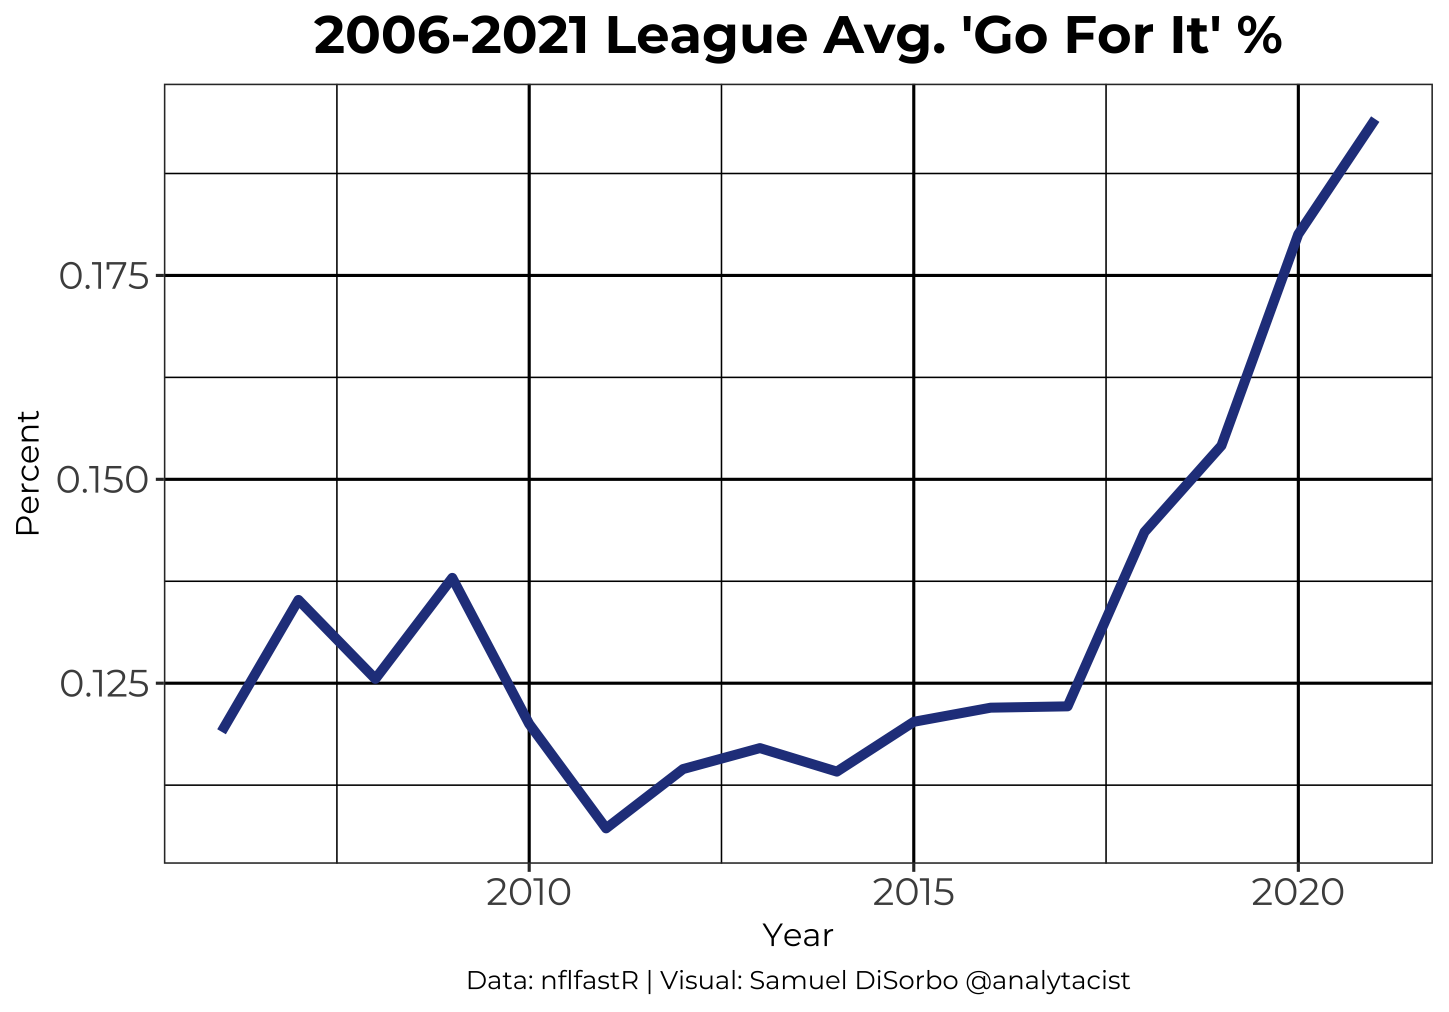
NFL Fourth Down Trends
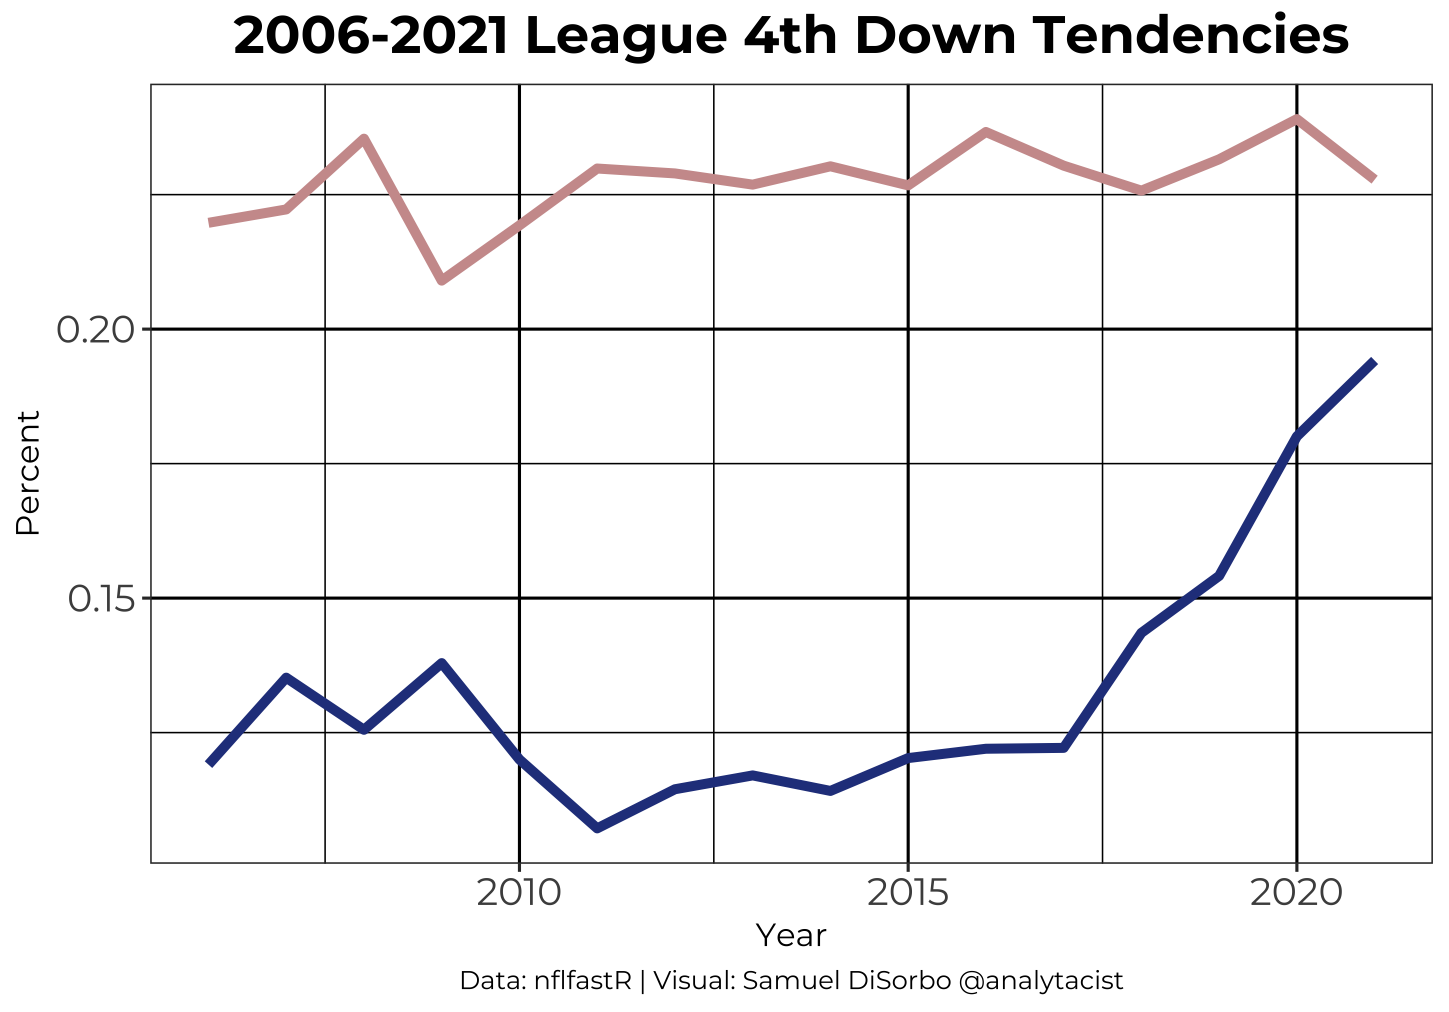
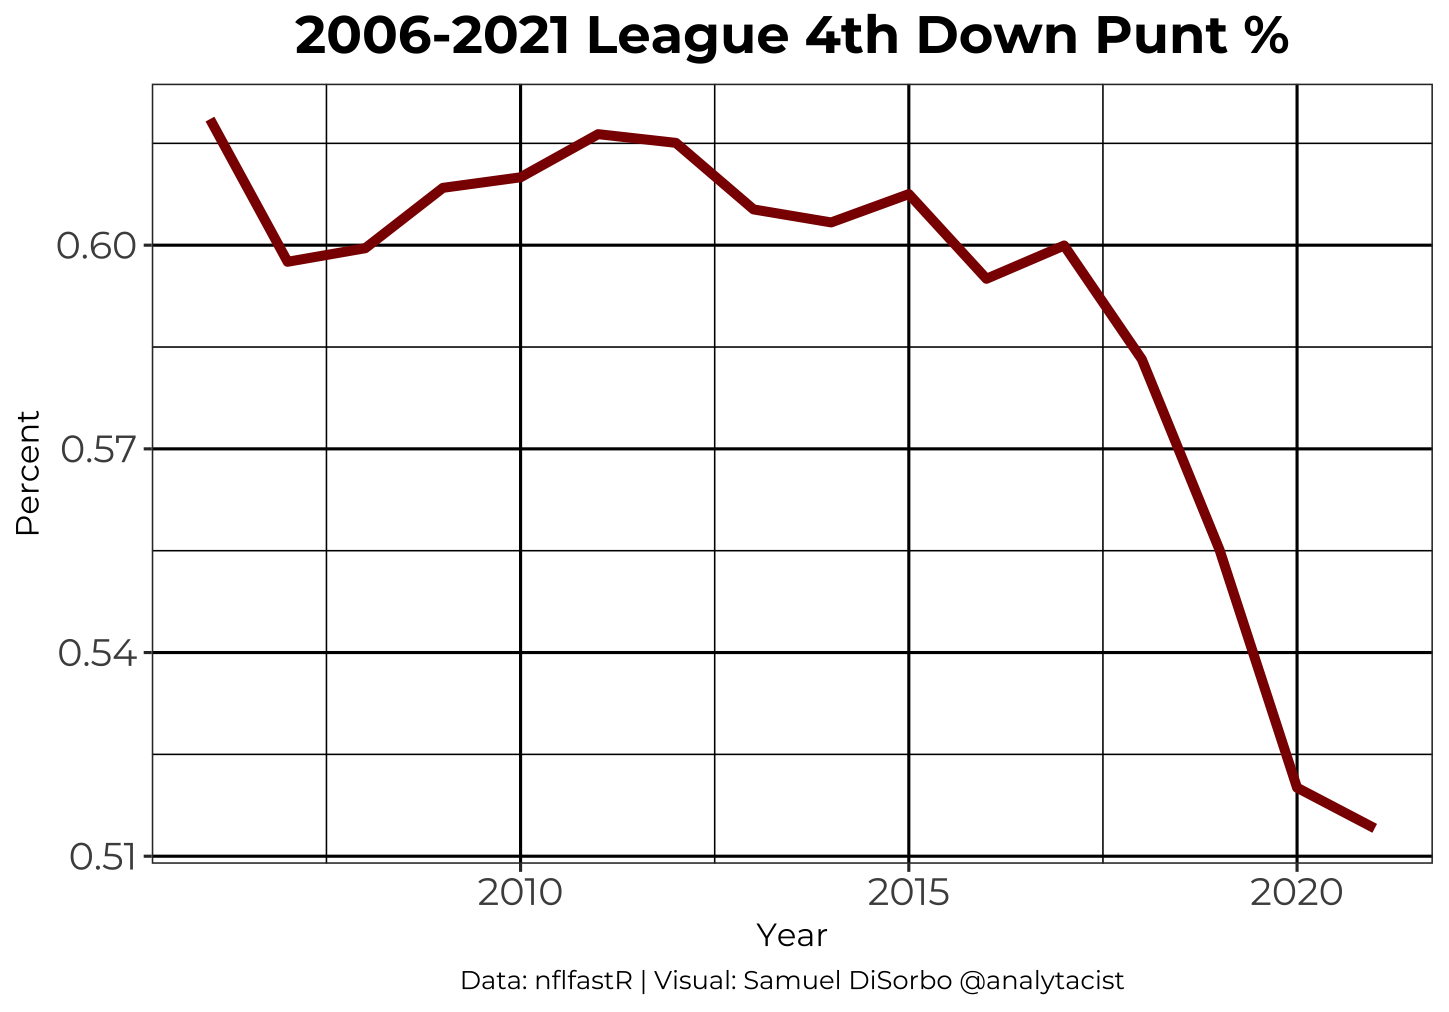
It may not come as a surprise to many that the NFL has become increasingly aggressive on fourth down in recent years. Since 2017, there has been a massive uptick in ‘go for it’ percentage, which coincides with the analytics movement that has been growing since then. Fourth down field goal attempt percentage has stayed relatively consistent (pink line), while punt attempt percentage has taken a massive drop. Down around 14% since 2006, punting is becoming less favorable in the minds of NFL head coaches. This is hard evidence that the league is adapting, in part to advanced analytics!
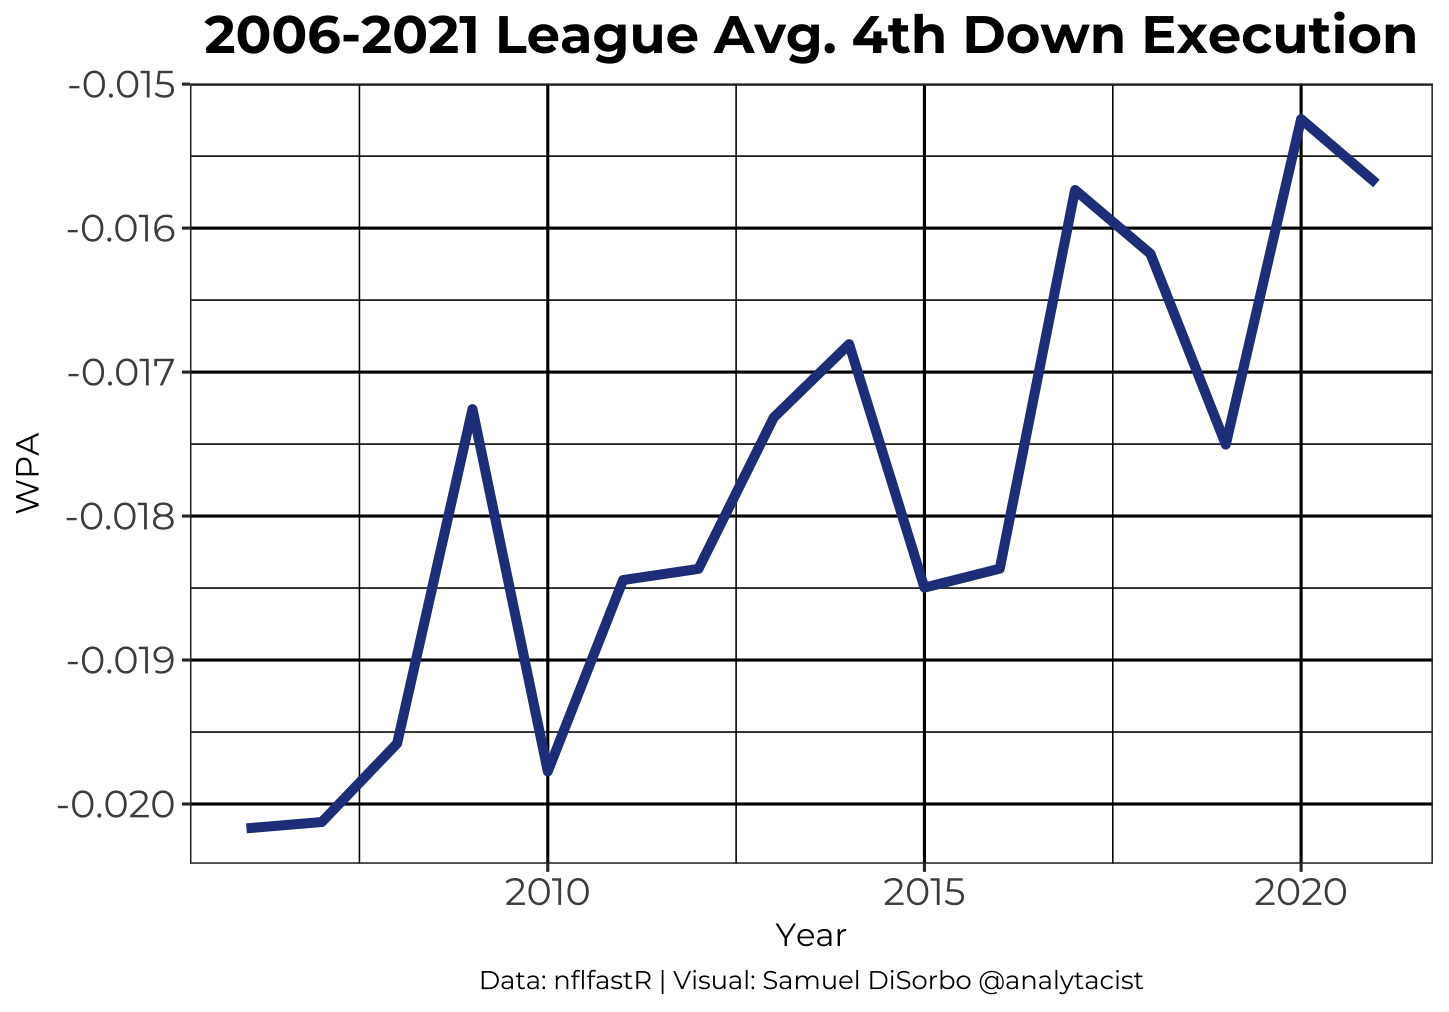
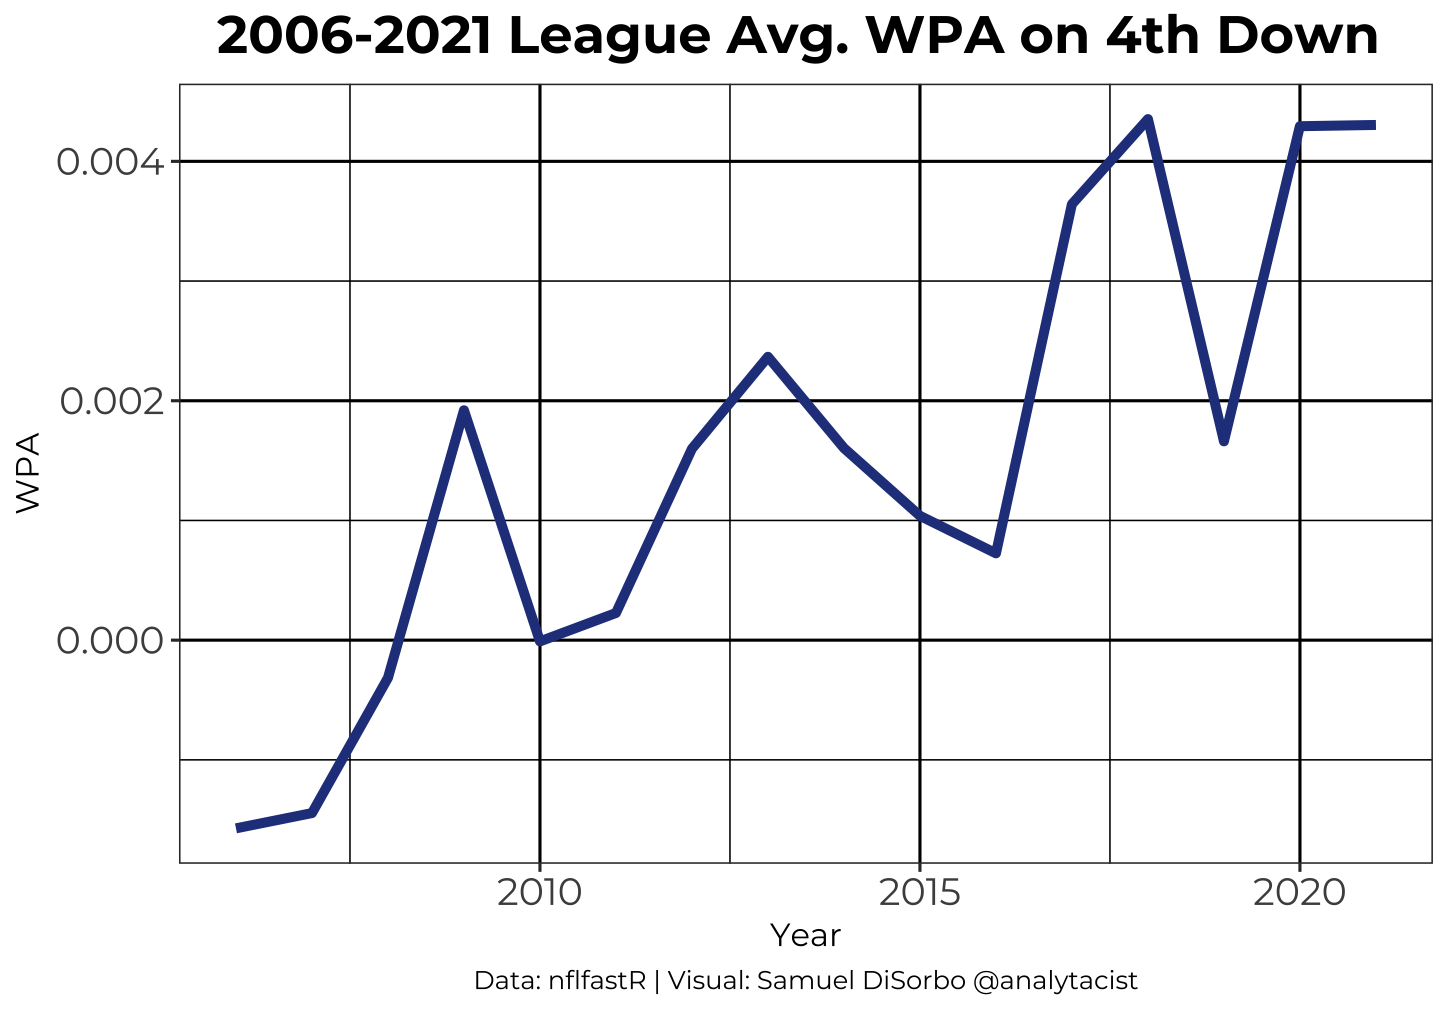
Teams have also become better at their execution on fourth down as well. They are getting better at reaching their highest potential on fourth down and putting themselves in better situations to win. As we can see in the second slide, the 0.5% increase in average WPA on fourth down displays the league’s growth in not only strategic performance, but aggressiveness.
STALEY Decision Analysis
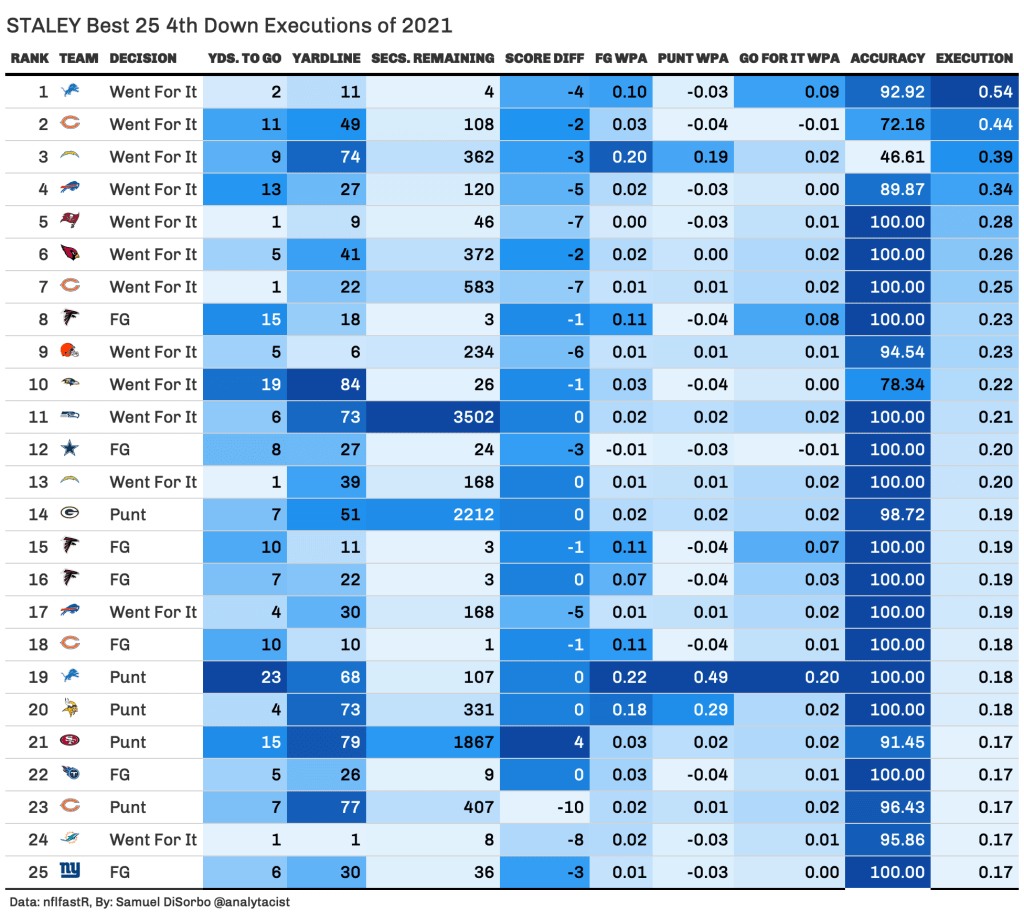
Let’s take a look at what STALEY thinks about some of last season’s fourth down decisions. Before you look at the top 25 executed fourth down plays of 2021 (ranked by STALEY), let me shed some light on a couple of metrics:
WPA: Win Percentage Added
Execution: Actual WPA – Maximum Expected WPA
Accuracy: % of max WPA expected (dependent on fourth down decision choice)
This table will highlight the team decision, the game situation, STALEY’s predictions for WPA for each decision, and of course, the accuracy and execution of each choice/play (notice how most of these are plays where they went for it, and how high the accuracy of these decisions are).
Here is the link to watch the best executed fourth down of the 2021 season, performed by the Detroit Lions. Before you watch, see if you can guess what this play was!
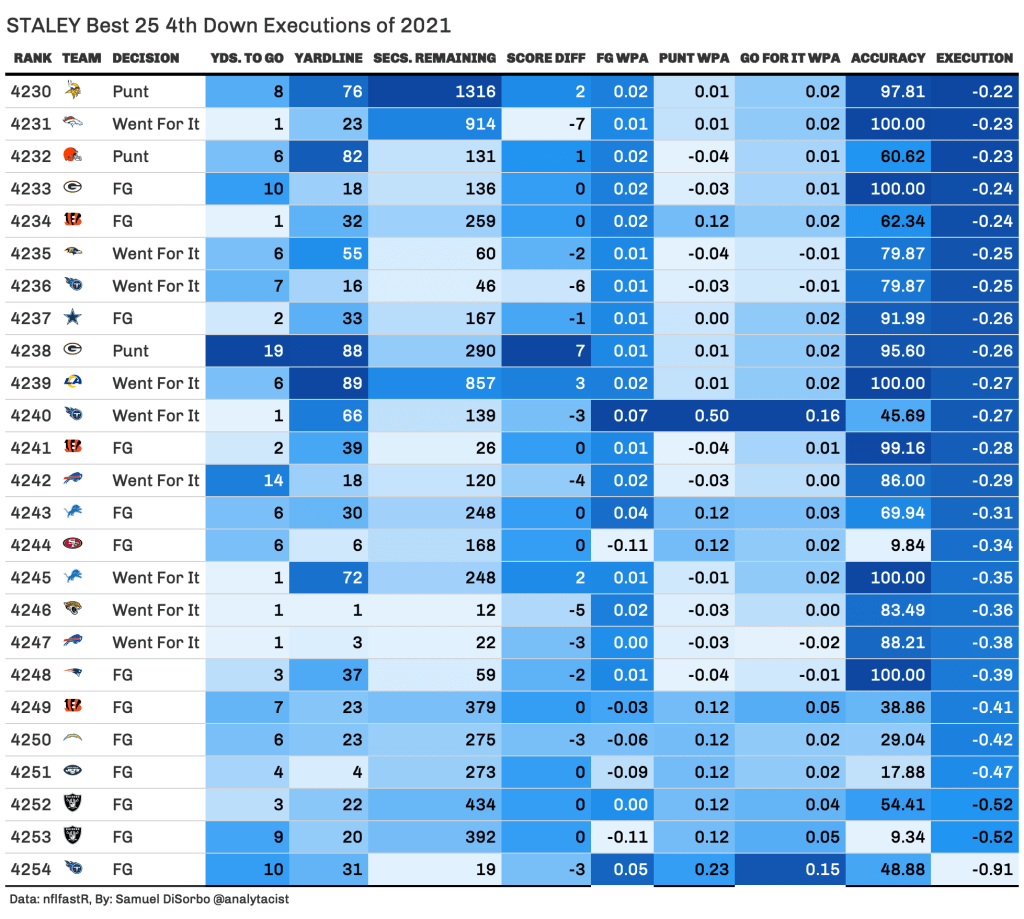
Now let’s take a look at the worst executed fourth downs of 2021. As you’ll see, some of STALEY’s decisions seem a bit misguided, which of course can be pointed to its inability to think rationally. Notice that a lot of these plays have high accuracy, meaning the coaches made the correct decision but executed their plans poorly. This can be attributed to bad luck in most/many cases.
One of the most controversial plays of the 2021 season was when the Bills went for it on fourth down against the Titans down 3 on the 3-yard line. This play was one of the worst executed plays of 2021, but was actually not a terrible decision by Sean McDermott (88.21% accuracy). Watch the play with this link.
To watch the worst executed play of 2021, follow this link.
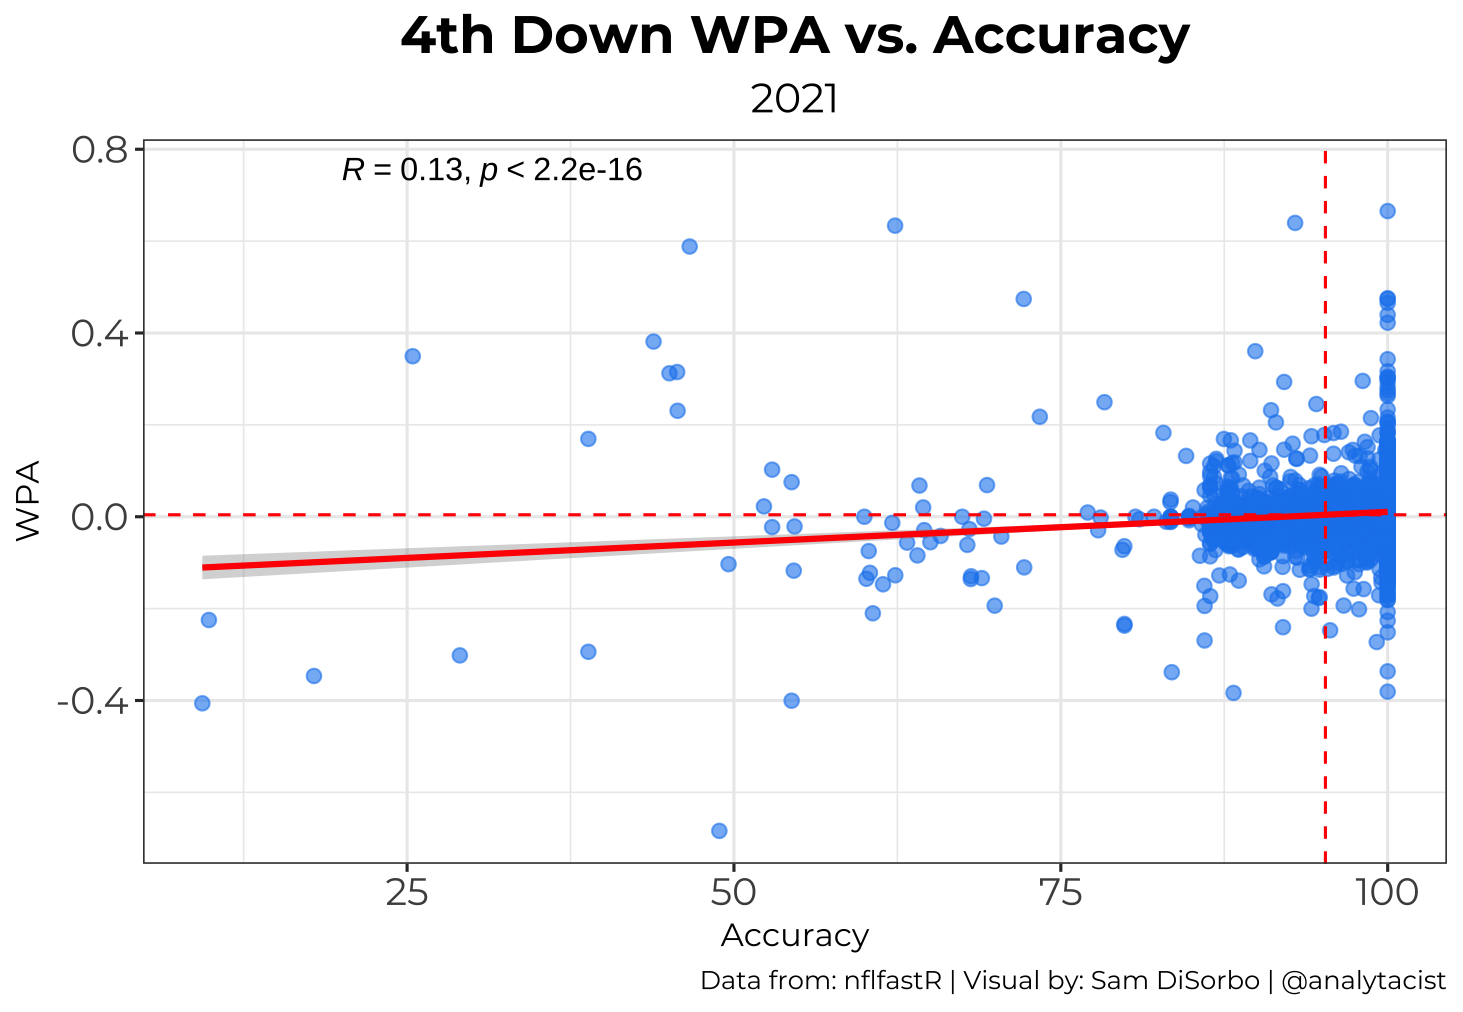
Does execution correlate with accuracy? Yes, a little. This visual isn’t incredibly helpful because the accuracy ratings are all so clustered together, but it tells us about 30% of the variation in execution can be explained by the variation in accuracy.

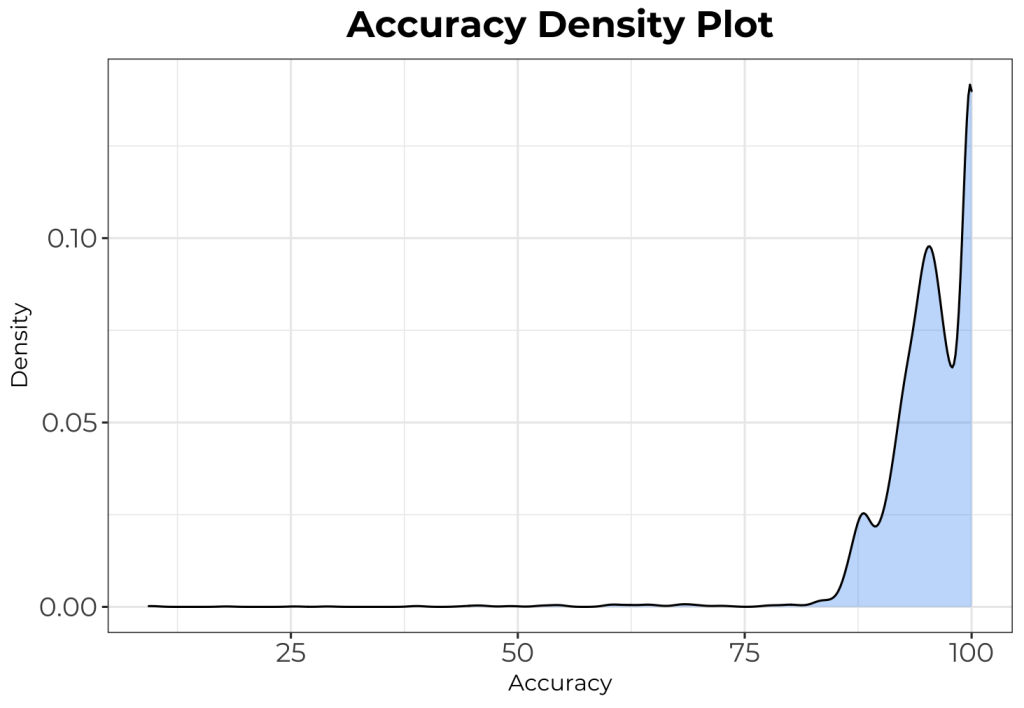
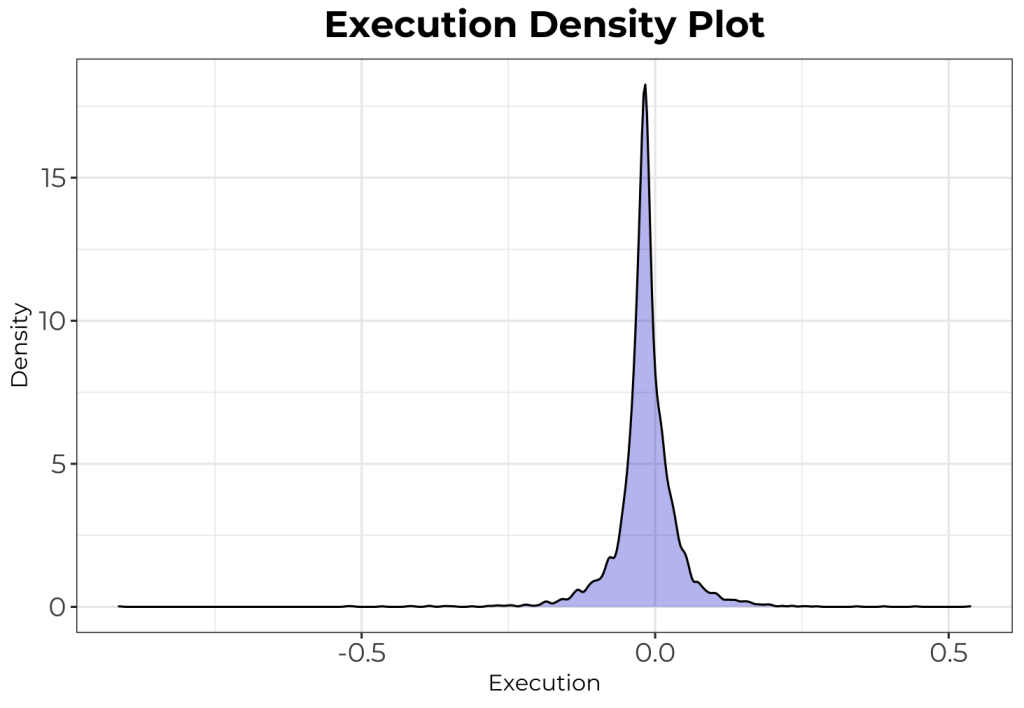
One area STALEY definitely can be improved in is its accuracy scores. They are a bit diluted because I had to deal with calculating percentages with negative values and didn’t think a percent difference score would suffice. Because of this, I had to scale the data to make it possible, which made the outcome a bit lopsided, as you can see below. Regardless, we can see that teams are very fairly accurate with their decisions. This does mean, however, that small differences in accuracy are more meaningful.
The execution density plot is somewhat normal, and it makes a lot of sense that most fourth downs have net 0 execution, as teams are generally accurate with their decisions and average with their play executions (not over or under performing).
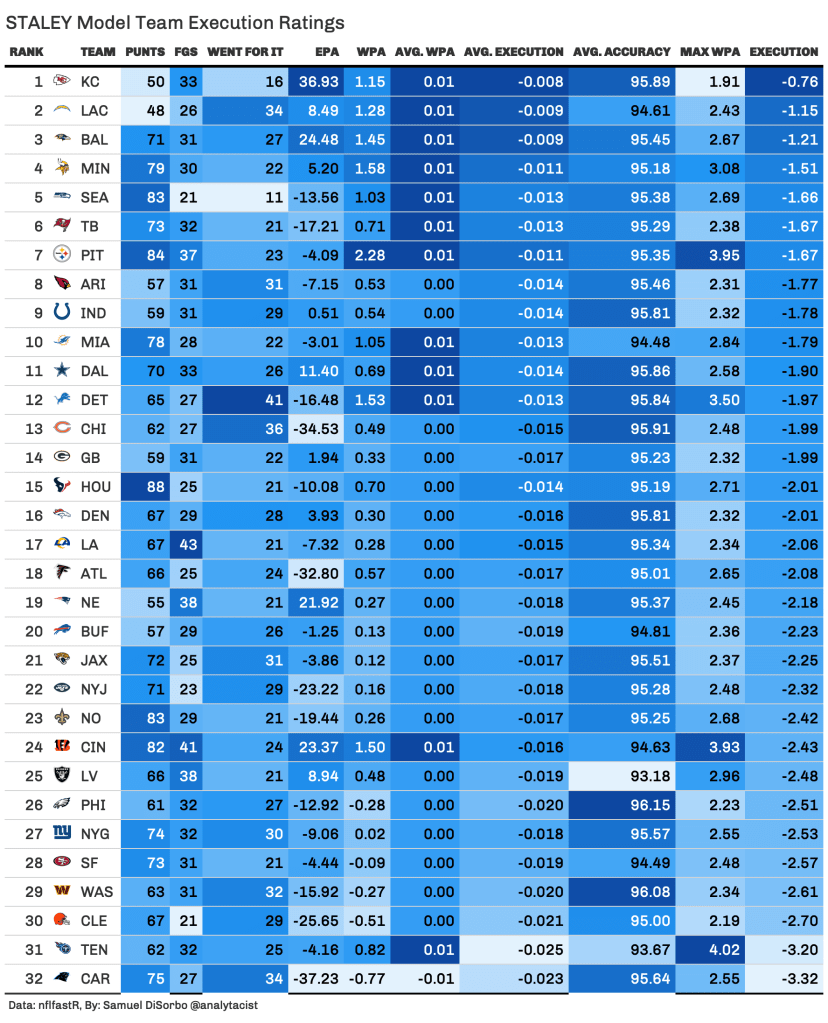
STALEY Team Rankings
Last but not least, here are the STALEY model team rankings by total execution in 2021. As you’ve probably guessed by now, the Chargers (backed by head coach Brandon Staley) are second on the leaderboard, which helped inspire the name of this model!
Some key takeaways:
- Teams have very high accuracies! Small differences in accuracies are a big deal!
- Teams have poor execution on fourth down. Not one team had an average execution above 0, nor did one have a total execution above 0.
- Just because teams have poor execution doesn’t mean they get poor results. A team can have a positive average WPA, but a negative execution when STALEY expected them to do better.
That’s all for this article! Be sure to stay tuned for more STALEY articles throughout the season! Give me a follow on Twitter @analytacist if you want to get updates for more articles or STALEY info, or if you have any questions about this model! Cheers to STALEY!
