
What is EPA?
Expected Points Added (EPA) is the most commonly referenced statistic in football analytics circles. The stat is based on Expected Points, which measures how many points a team, on average, is expected to score on a possession given a particular field position. A possession’s Expected Points may range from close to 7, which would occur in a situation like 1st and Goal at the 1 yard line where a team is very likely to score a TD, to negative numbers where the defending team is the most likely team to score next, which would occur when a team is backed up deep in their own territory. EPA measures the change in Expected Points that occurs on each play. The great thing about EPA is that it accounts for the fact that not all yards have equal value. A 5-yard gain on 4th and Goal at the 5 is very different from a 5-yard gain on 3rd and 20. EPA captures this and has become the leading way to quantify a team’s offensive and defensive efficiency
The Problem
For fans who are unfamiliar with the metric, understanding EPA and EPA/Play can be difficult because of the way that the data is presented. Average EPA/Play numbers for teams in the NFL typically range from -0.2 (bad offense, good defense) to 0.2 (good offense, bad defense). Because these numbers are so small and unregulated, it can be hard to understand whats being communicated. What does the Kansas City Chiefs offense averaging 0.2 EPA/Play mean to someone who doesn’t know what an average EPA/Play looks like? We can certainly use data visualization to show how impressive that is comparatively, but we can also go one step further to present EPA metrics themselves in a more appetizing way that fans can better understand.
The Rise of “+” Stats
To combat similar issues of unclear numerical representations, statisticians in baseball developed a way to standardize their advanced metrics to make consumption easier for the public. A great example of this is OPS+, which adjusted the popular advanced stat OPS (On-base Plus Slugging) that accounted for how often a batter reaches base and how impactful their hits are. OPS numbers typically ranged from .500 to 1.000 and while fans had a sense of what was a good OPS and what was a bad OPS, it was hard to understand the degree of deviation from the mean that each OPS represented. So, OPS+ was created. The formula for OPS+ is just (OPS / league average OPS) * 100, which makes the average OPS+ 100 with an OPS+ over 100 being above-average and below 100 being below-average. OPS+ adjusted for league average OPS and gave fans an integer with which they could compare players statistics, which made the data easier to comprehend.
EPA+
To create our EPA+ formula, we need to tweak the OPS+ formula slightly. We can’t simply copy and paste the formula because unlike OPS, individual EPA/Play numbers can be multiple times higher or below league average EPA/Play. If we used the same formula and divided by league average EPA/Play , we could see elite players and teams like Patrick Mahomes and the Chiefs with laughably high EPA+ numbers that wouldn’t make EPA/Play data consumption easier. Instead, we can subtract players and teams EPA/Play from the average and then multiply by 100.
EPA+ = (EPA/Play – League Average EPA/Play) * 100
Using EPA+ to Analyze Teams
With our EPA+ formula, we can look at each teams offensive and defensive EPA+ and use 0 as the integer that represents league-average.
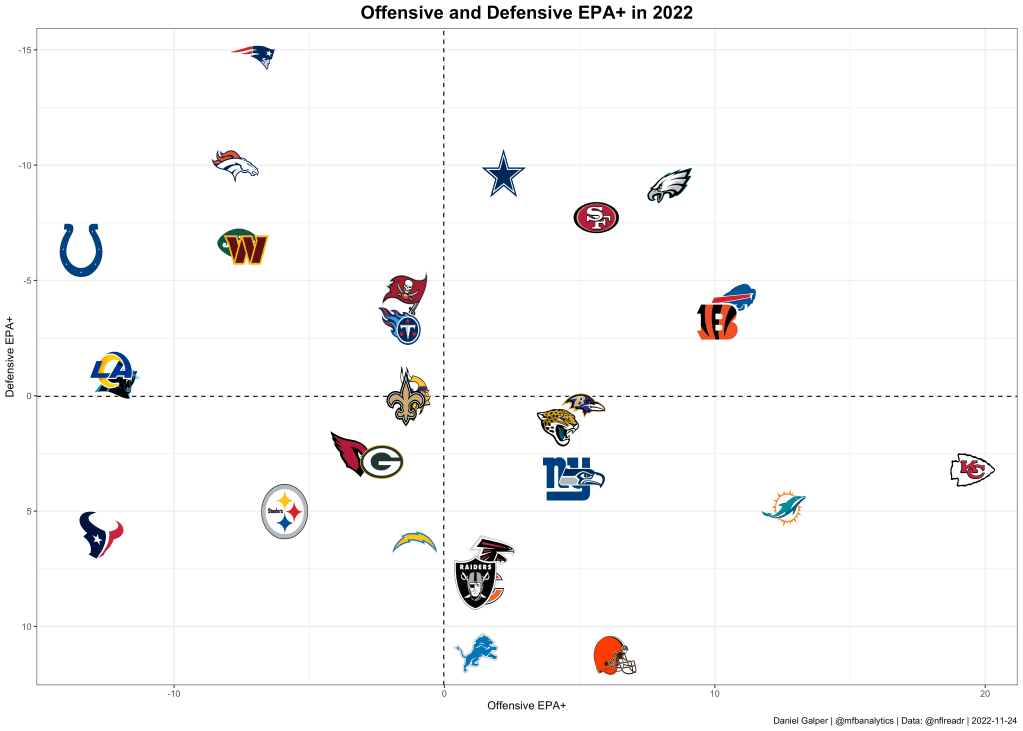
This graph looks like a normal EPA/Play graph with different axis numbers because league-average EPA/Play is very close to 0. In this case, the value provided by EPA+ is that the numbers being shown by are in the range of -20 to 20 instead of -0.2 to 0.2 which makes the data more consumable.
Using EPA+ to Analyze Players
The true power of EPA+ is leveraged when we need to measure EPA numbers where the league average is not 0. A quarterback’s EPA/Dropback numbers is one of the main ways their value is measured by the NFL analytics community. However, these numbers aren’t standardized as the average EPA/Dropback is about .03 and not 0. To apply our EPA+ formula to quarterbacks, we use the same formula.
Quarterback EPA+ = (EPA/Dropback – League Average EPA/Dropback) * 100
Now we have a standardized metric for analyzing each quarterback’s EPA/Dropback numbers where 0 is average.
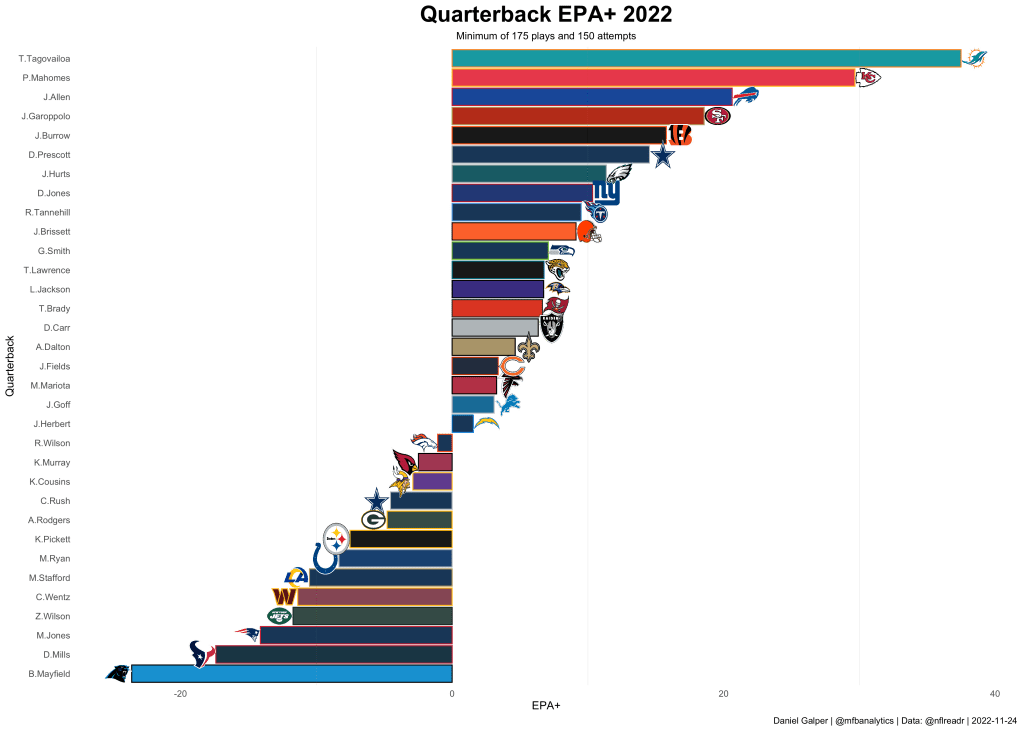
Representing EPA/Dropback in this way doesn’t change that players like Tua and Mahomes will top the rankings but it does give us a better understanding of how much each quarterback deviates from league average which is not represented by typical EPA metrics.
This formula can also be useful when dealing with EPA numbers for different positions like running back and wide receiver where average EPA/Touch is not 0 and we need to standardize our outcomes.
Using NET Ratings to Display Overall Performance
The NET rating has become wildly popular in the NBA as a way to combine offensive and defensive efficiency ratings. We can do the same thing in the NFL using team EPA+ data.
NET EPA+ formula: (Offensive EPA+) – (Defensive EPA+)
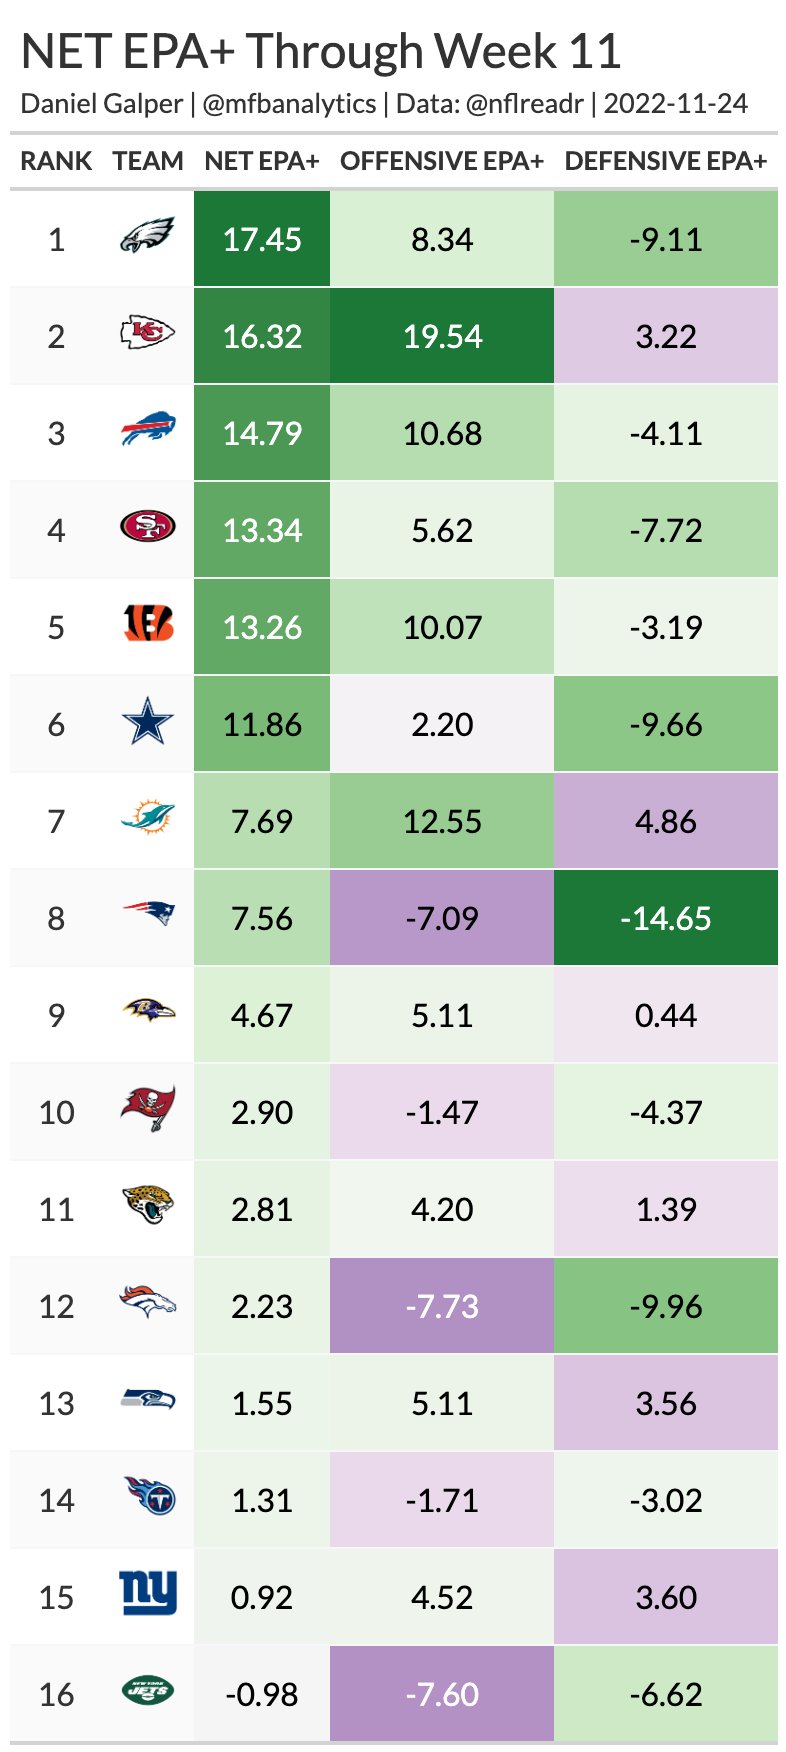

Representing a teams efficiency using a NET Rating makes it easy to understand how a team matches up with the rest of the league as 0, once again, is average. Here, we have a standardized and comprehensible way to use EPA data to represent the best teams in the NFL and how much better or worse they are compared to other teams. The only potential issue with representing NFL teams with NET ratings is that offensive output has been shown to be more predictable and stable than defensive output so weighting them equally may not be optimal. However, by showing team’s EPA+ on each side of the ball alongside their NET EPA+, we can show that some teams NET EPA+ is boosted heavily by their Defensive EPA+ and that their NET EPA+ ranking may not be as predictive of future success.
Conclusion
EPA+ and NET EPA+ are highly effective ways to transform hard to understand EPA data into readable and consumable numbers. The value of EPA+ is maximized when we analyze a specific position like quarterback and are able to standardize each players numbers using league averages. NET EPA+ boils a teams EPA data into one number that can be compared to a league average of 0. The table shown above presents a whole seasons worth of NFL EPA data as one comprehensible visualization that makes every fan smarter and helps them understand how their favorite team stacks up against the rest of the league. EPA is the future of NFL analysis and EPA+ is the best way to present that information to fans and experts alike.
