
In this article, I will be breaking down my newest betting model, ALICE, which stands for Adaptive (spread) Learning (with xGBoost) Corrective Error (techniques). If you haven’t read my articles about my first betting model, REBEL, the links are here and here for your convenience. This model is built using an extreme gradient boosted algorithm, similar to REBEL’s. For those of you who aren’t familiar with ‘boosted’ models, you can learn more about them at this link. In short, it is a supervised learning algorithm, which attempts to predict target variables by combining prior predictions from weaker and underdeveloped models.
I understand that this article may be a bit lengthy, so if you want to skip around a bit, here are the links to each section
Building the Model
I know what you’re thinking. Another boosted model? What is it with this guy? While this is my third time using this method, there is a saying that states ‘don’t fix what ain’t broke’, which seems to apply to my situation. My REBEL model performed excellently on its tests for the NCAAF and the NFL, making me eager to test the limits of the boosting technique. Without further adieu, let’s jump into this article and learn how ALICE runs.
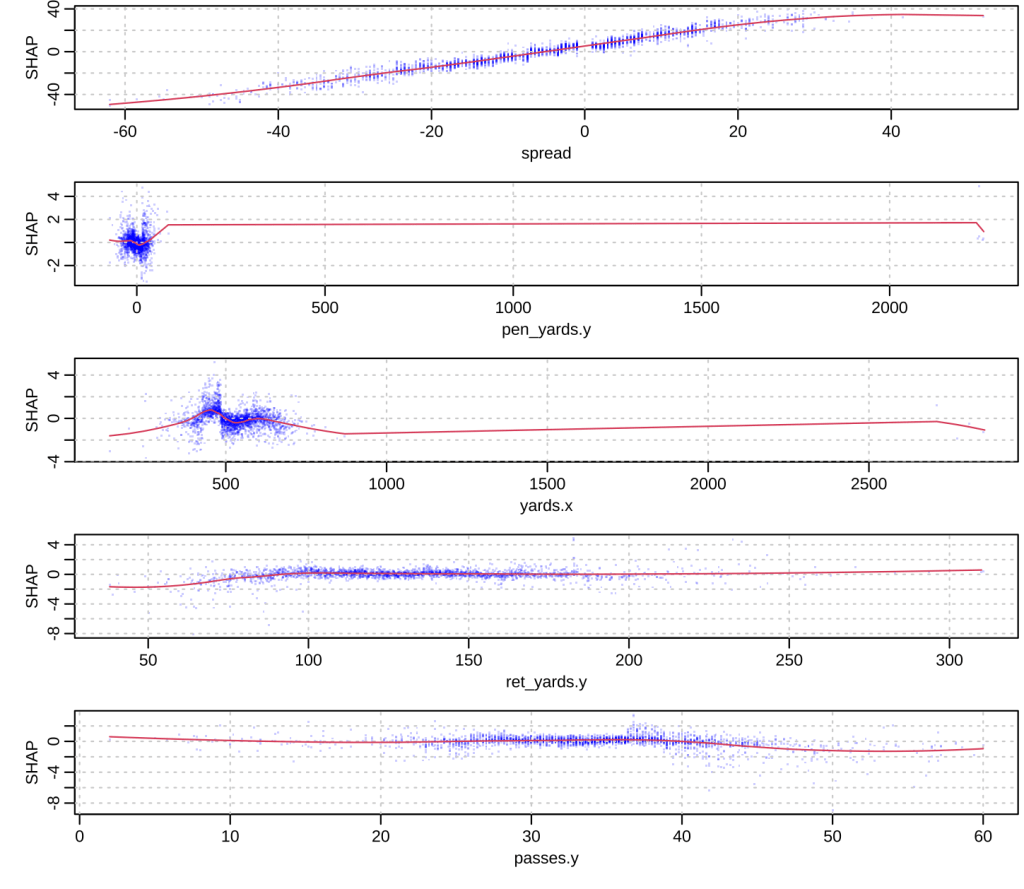
As we know, extreme gradient boosted models are predictive models that intake a number of metrics in order to make each assumption. In the case of ALICE, we are trying to predict the spread of NCAAF games using the 5-game rolling mean metrics of the following: Vegas spread, yards, touchdowns, penalty yards, return yards, kick yards, turnovers, takeaways, sacks, EPA, rushes, passes, avg. total points and field goals made. In the graphic below, we can see which metrics affected each prediction the most, according to their SHAP values (each blue point shows a data value for a single feature and how widely it affected the model prediction–SHAP value). It makes a lot of sense that the Vegas spread is the most influential for this model–after all, what better way to spread lines than by using the spread that the market provides? Home yards being influential also makes sense, as the spread is usually set to the home team, which means their yard total would have a high influence on what our model predicts. It seems more unusual to see away penalty yards, away return yards, and away passes as the other top three influencers, but you really never know what metrics are going to help your model gain an edge.
Testing ALICE
I tested the accuracy of this model in two ways–one being the generic, “what percent of the model’s” bets were correct (which certainly is helpful), and the other using F-Scores (which improve accuracy judgments on imbalanced datasets).
Let’s start off with our basic tests. As we know, we must get at least 52.4% of our bets correctly to beat the market and turn a profit. ALICE correctly made 56.4% of its 663 bets, which beats the market by a whopping 4%! Constructing a 95% confidence interval gives us even better news, as our interval states that we are 95% confident that this model has a bet accuracy between 52.6% and 60.2%! While this is great news, there is one glaring thing to note–this is ALICE’s performance on predicting away team’s to cover rather than not (ALICE always bases its bet on whether it thinks the away team will cover or not). Of the 335 games ALICE predicted the away team would cover, it got 65.4% correct. On the flip side, of the 328 games ALICE predicted the away team would not cover it only got 47.3% correct. Fortunately, this is no reason to panic. A number of things could have gone wrong here–we simply could have gotten unlucky; perhaps next year, ALICE will perform more favorably on predicting teams to not cover. Regardless, some models are better at predicting certain things than others–what is important is that we use them correctly by using the edges they give us to our advantage.
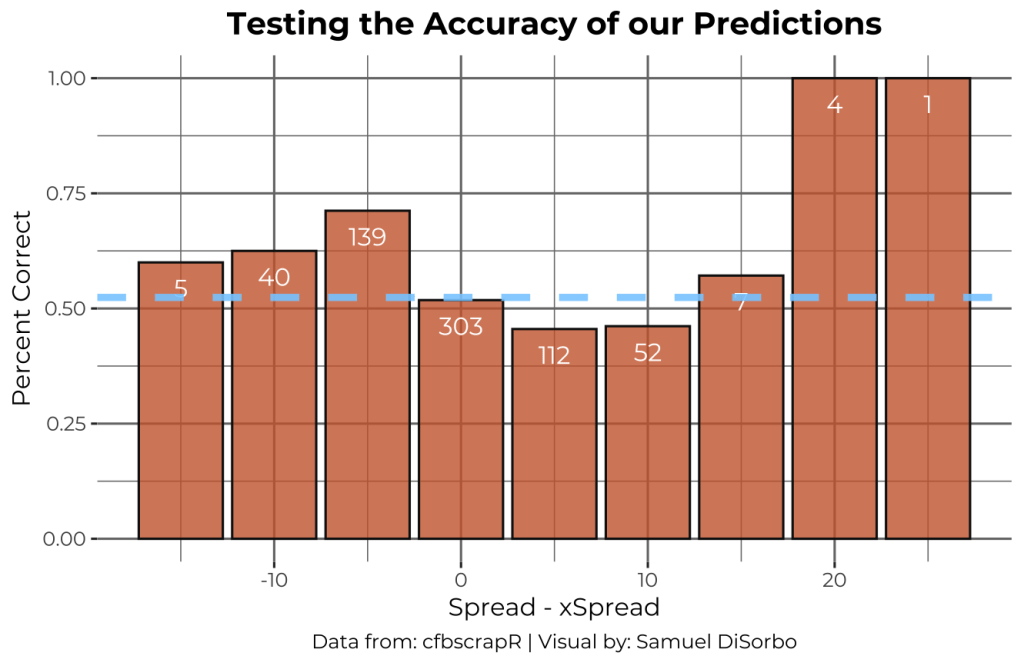
Below we can see how ALICE performed on every prediction for the difference between the Vegas spread and the ALICE spread. It is noticeable that the model performs best when the difference is further from 0.
Now let’s take a look at our F-score report. If you’re not familiar, an F-score is another way to judge a model’s efficiency, but what separates it from a simple accuracy score is its attention precision and recall. These are numbers that gauge your model’s effectiveness in determining true positives, false positives, and false negatives.
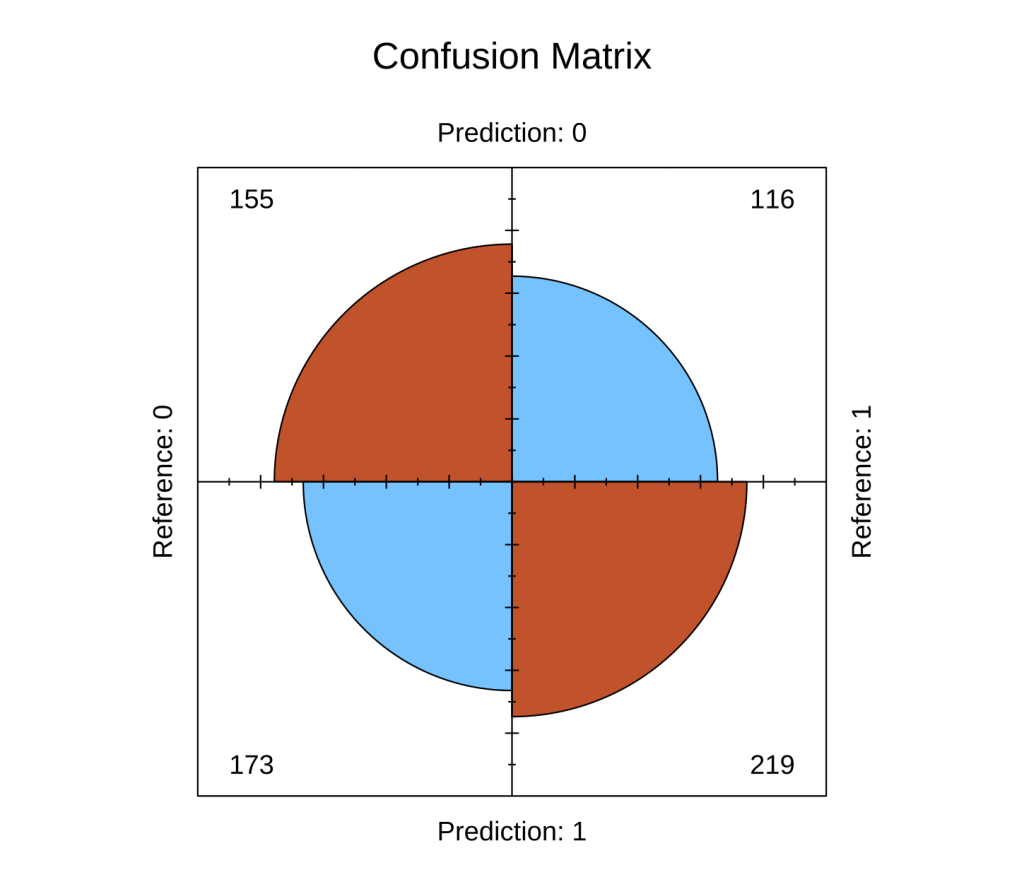
Using a confusion matrix test, we get these F-Score results:
Precision : 0.5587
Recall : 0.6537
F1 : 0.6025
Balanced Accuracy : 0.5631
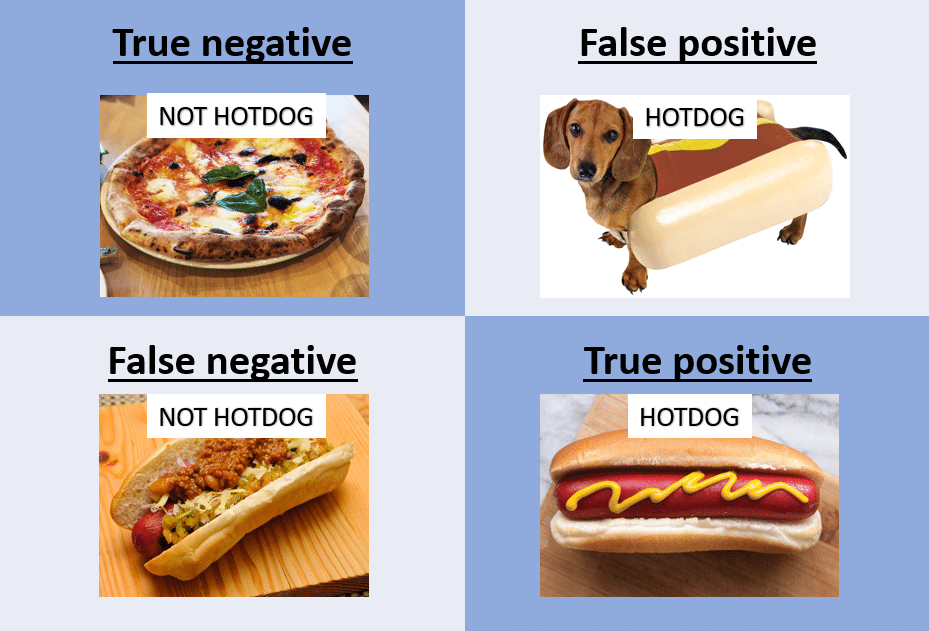
This tells us that ALICE is better at recall than precision, meaning it is skilled at not missing out on positive observations rather than being ‘precise’ with its predictions on positive observations (my one-sentence explanation may be a bit perplexing, so here is an article depicting the two terms for more info). Check out the confusion matrix below to see how ALICE did with, true negatives, false positives, false negatives, and true positives (I included a funny, but useful image to understand the matrix graphic in the second slide).
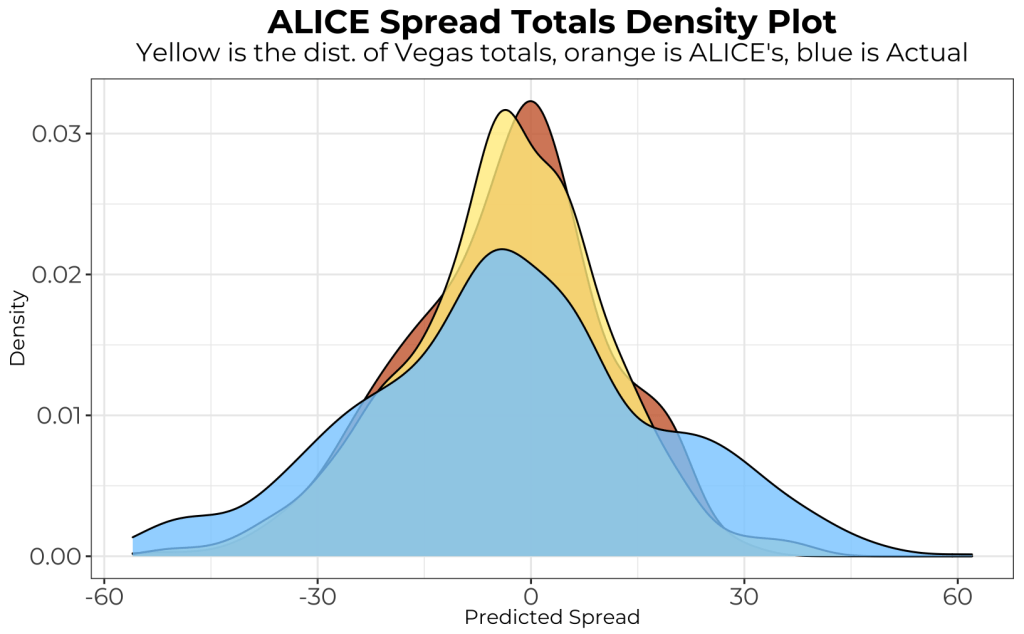
The distributions between spread of Vegas, ALICE, and the actual outcome are plotted below. It makes sense to see the two models having less variance than the actual spread outcomes, as it is difficult for them to predict certain random events that happen on a game-to-game basis (hence them being models). Depending on ALICE’s performance in 2022, I could try to make its predictions more evenly (normally) distributed by raising the xGBoost model gamma value.
ALICE 2021 Earnings
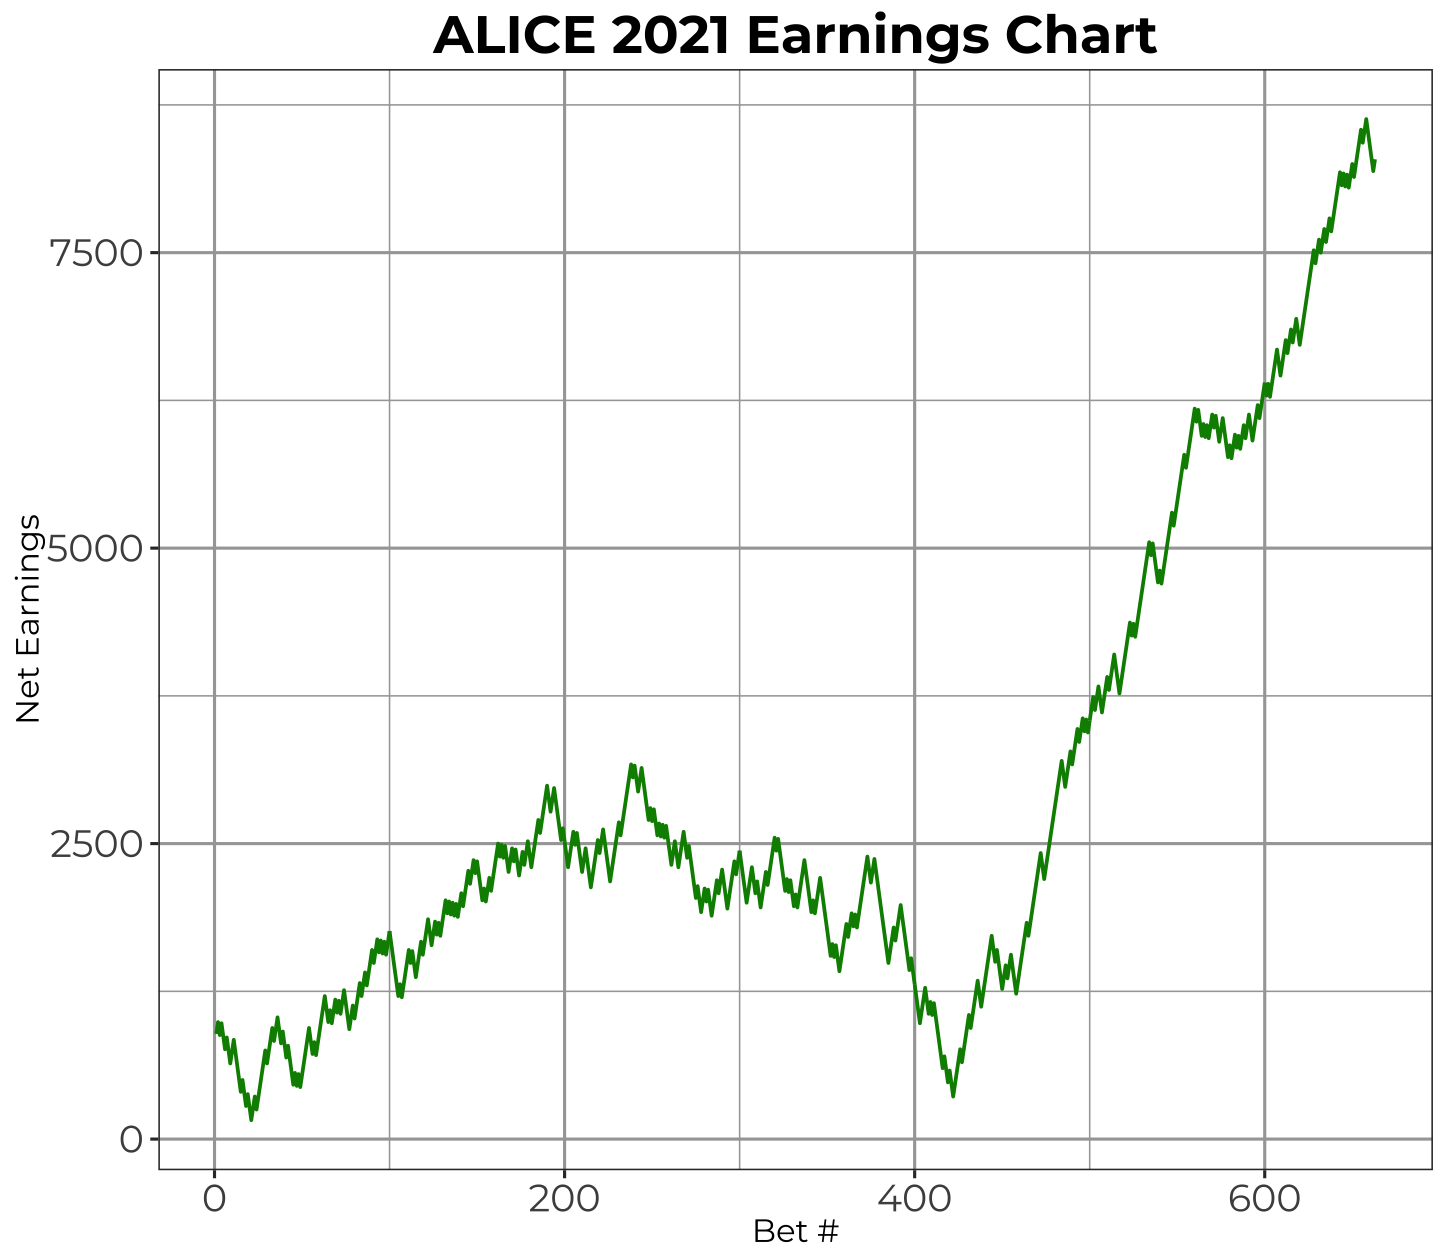
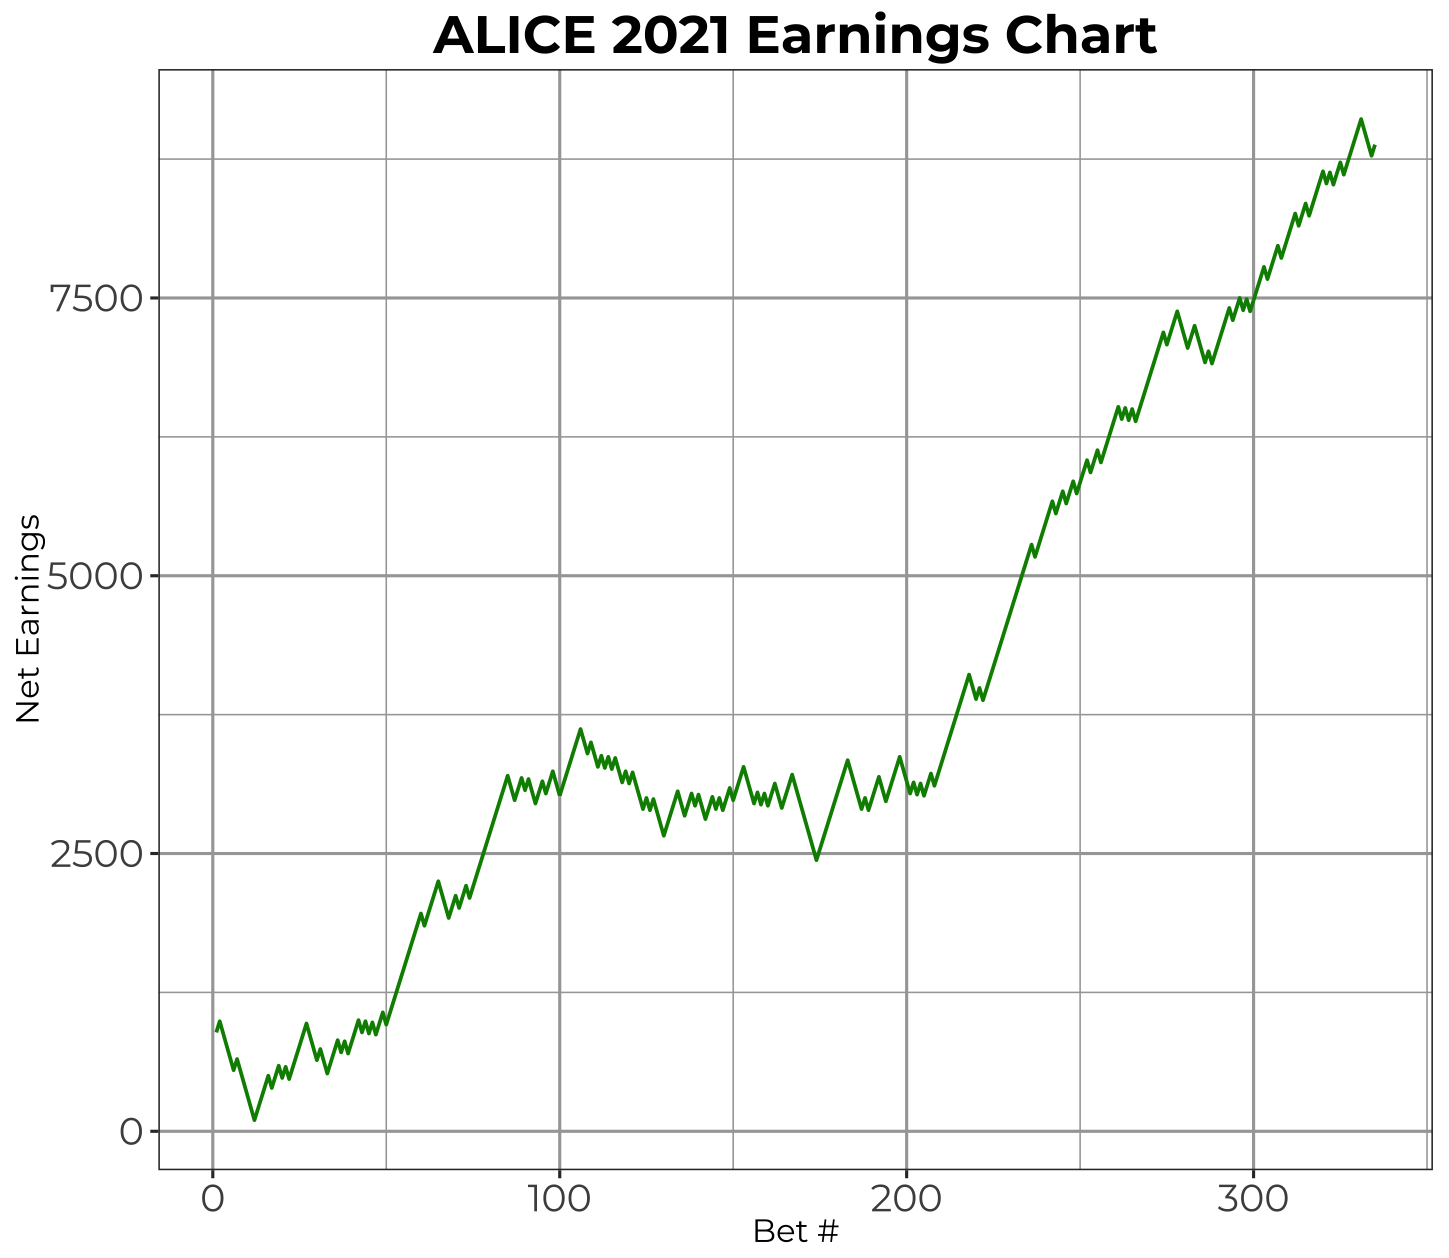
Now let’s get into the bread and butter: 2021 (test) earnings. Taking every bet that ALICE produced during its test run on the 2021 season, I plotted what would have been the earnings chart for the bets (with a few assumptions).
- Started with $1,000 (assuming my pockets are deep and I can go negative/bet more than I have to make all picks)
- Bet $100 each bet at -110 odds (avg. spread odds)
As I mentioned earlier how it might be a smarter strategy to only bet when ALICE predicts the away team to cover, I also plotted the results of this strategy in the second slide. They are incredibly similar but offer a smaller dip and less variation. I would imagine that this strategy would be more effective than taking every bet if continued over a longer period of time.
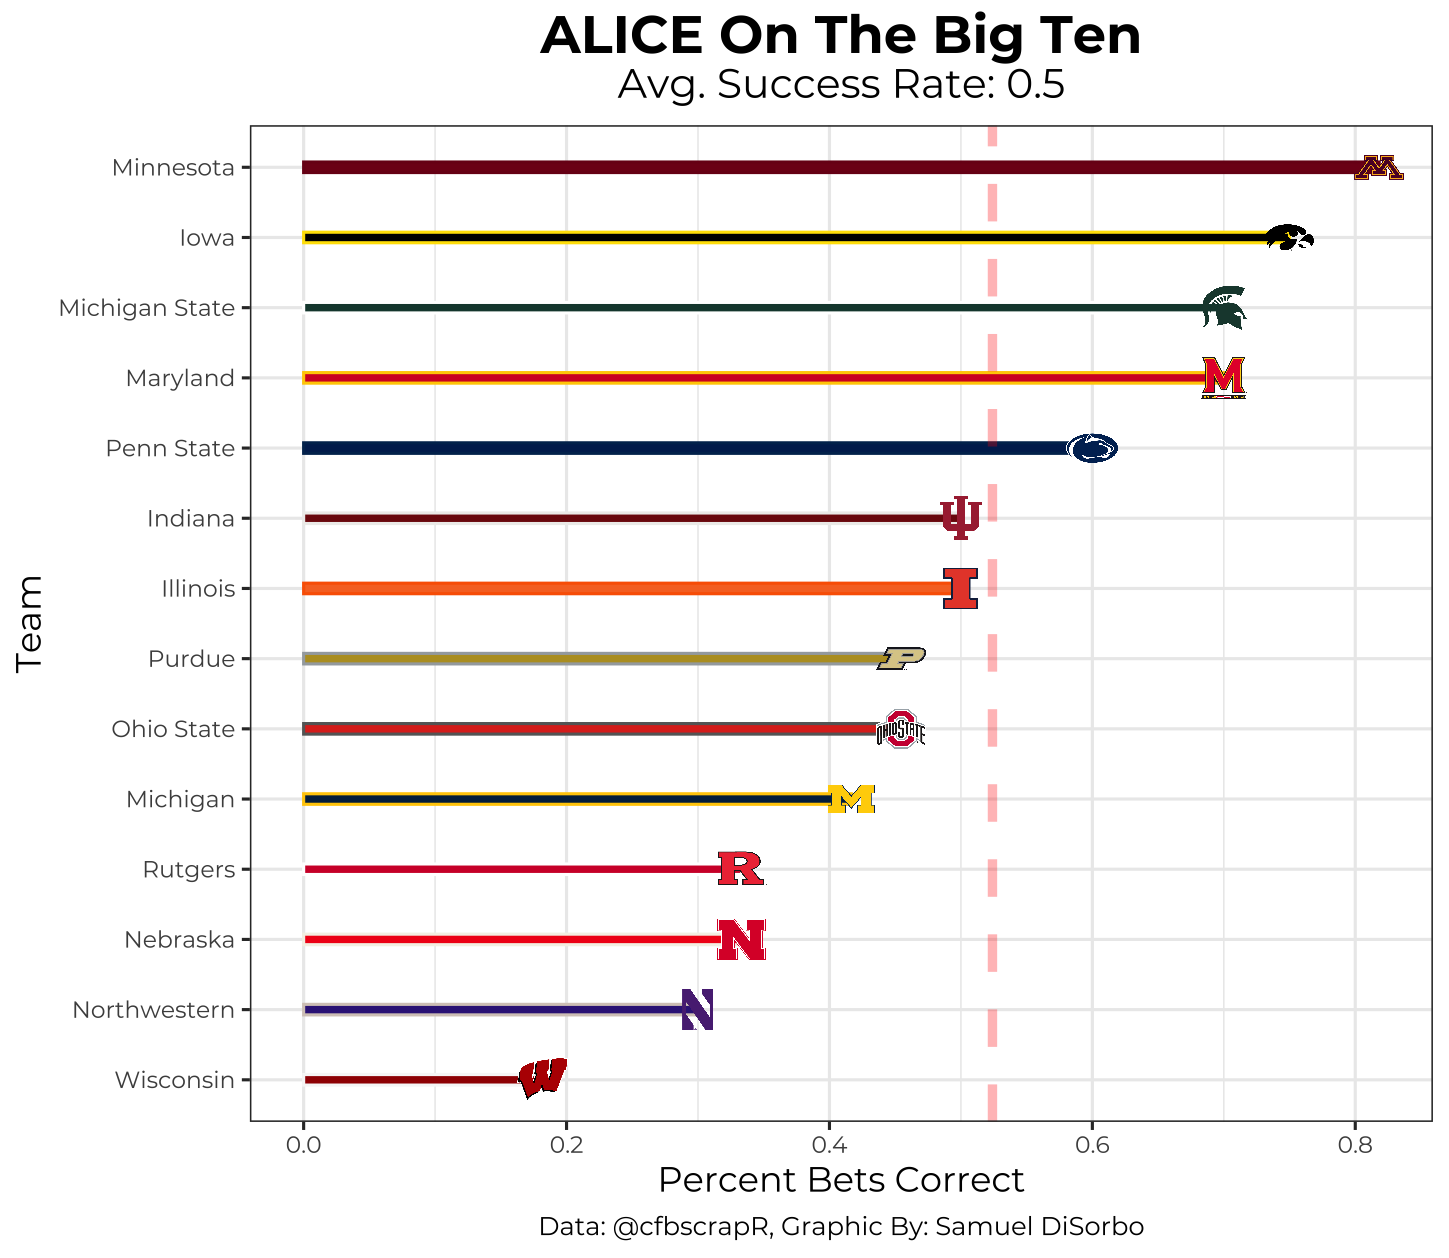
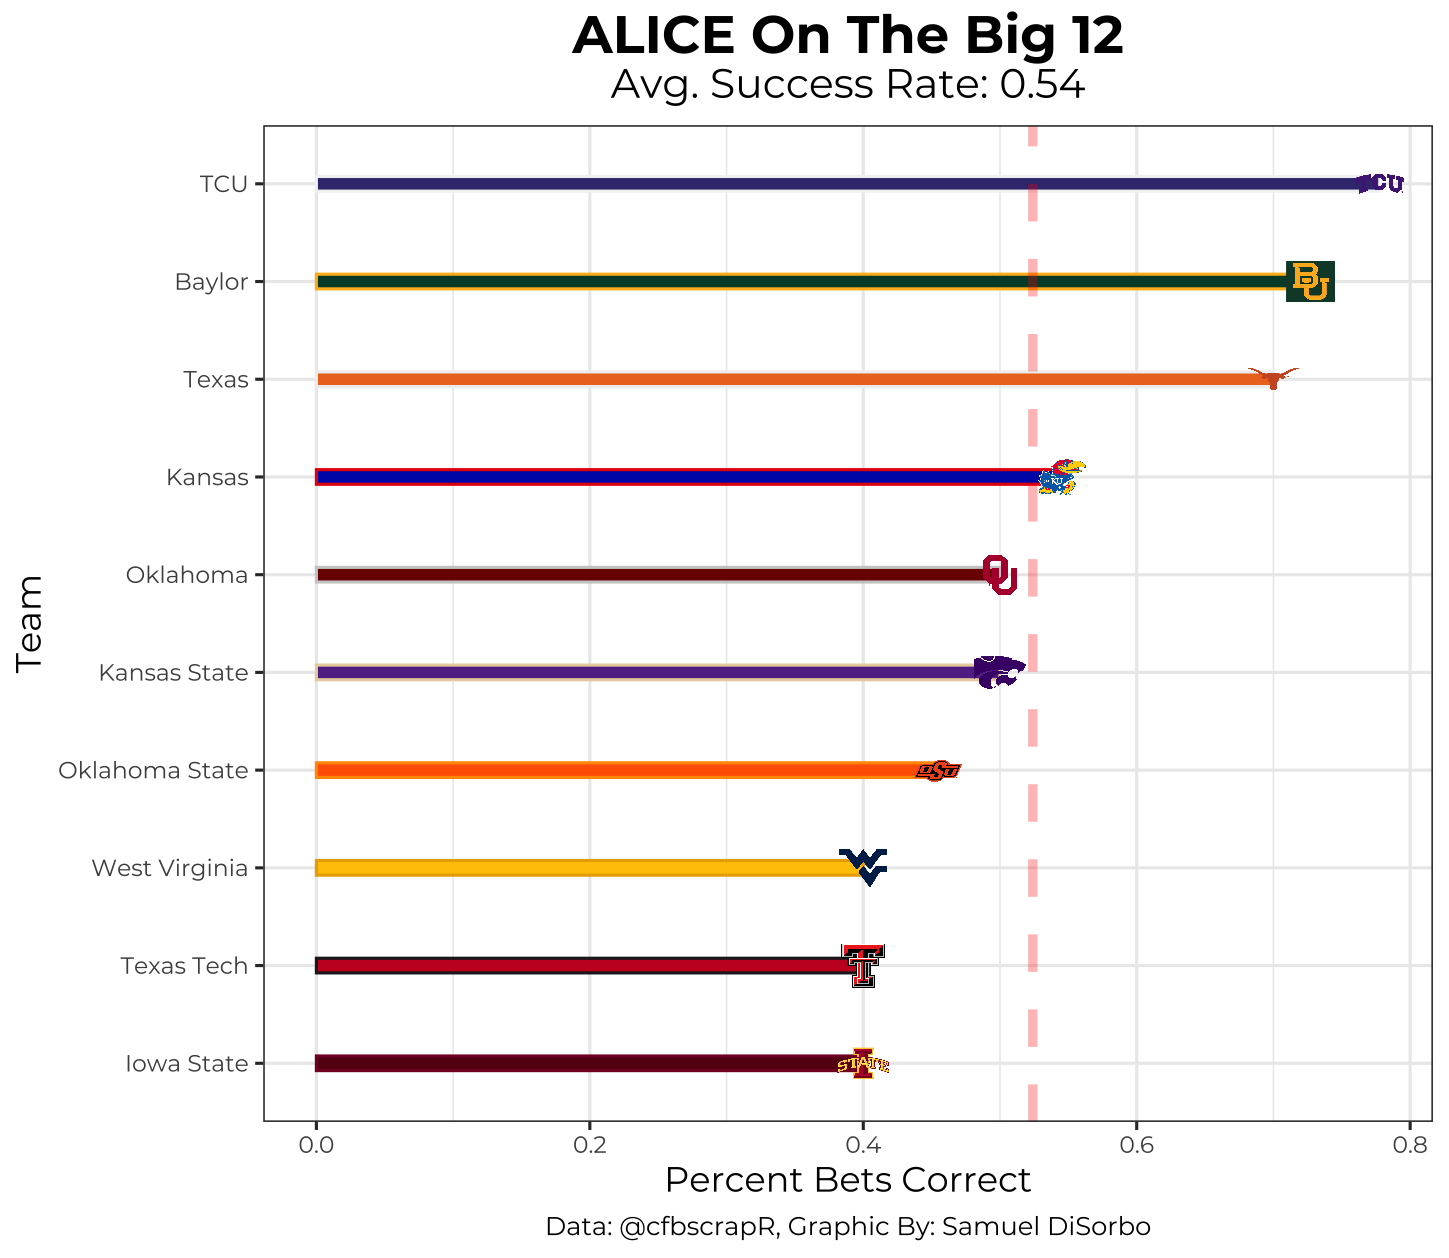
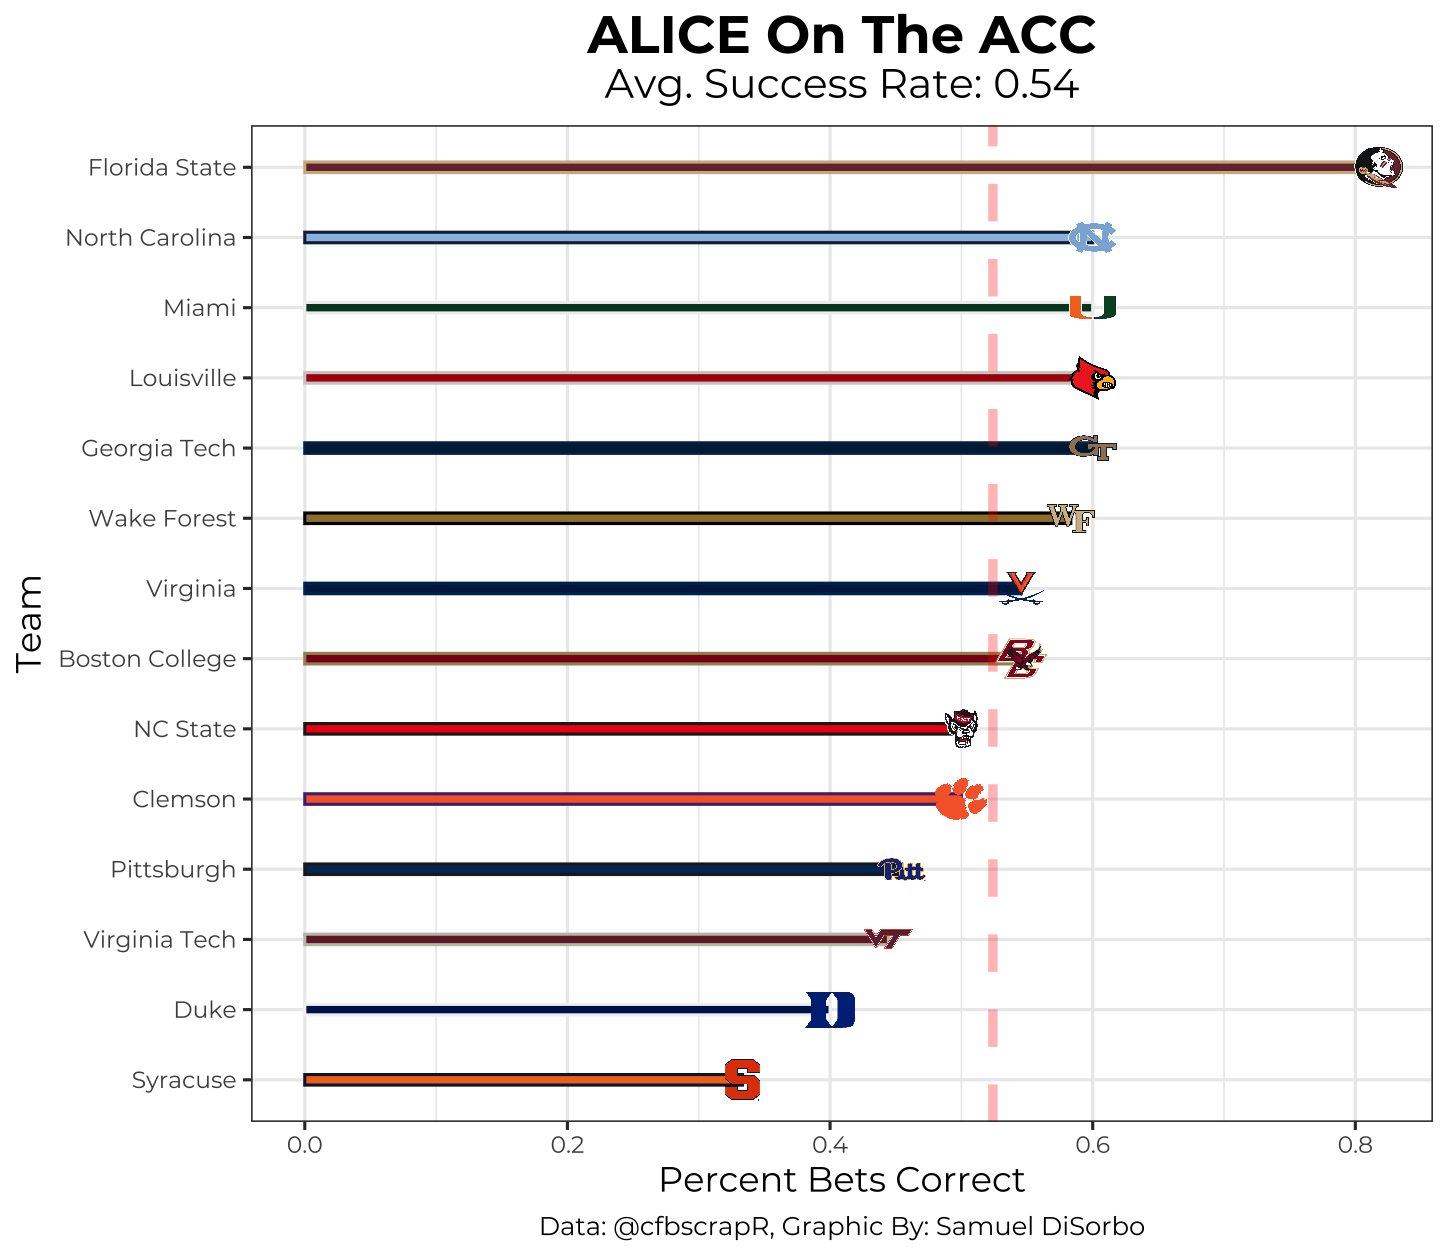
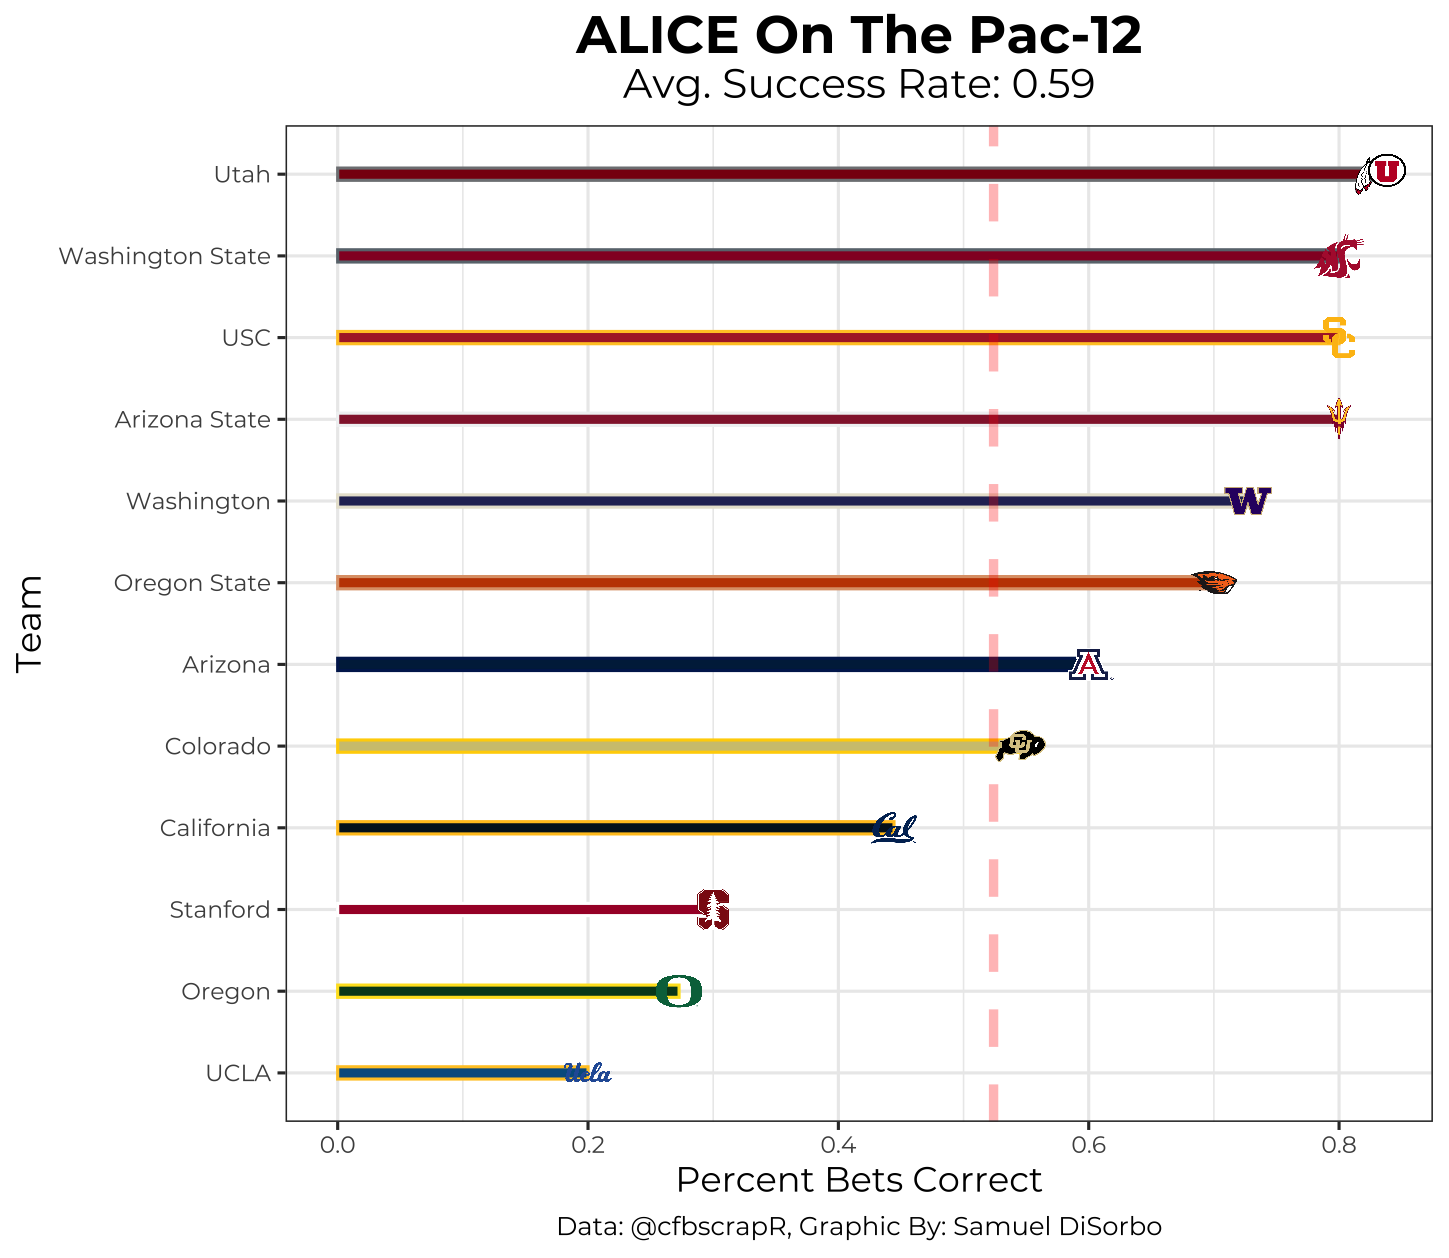
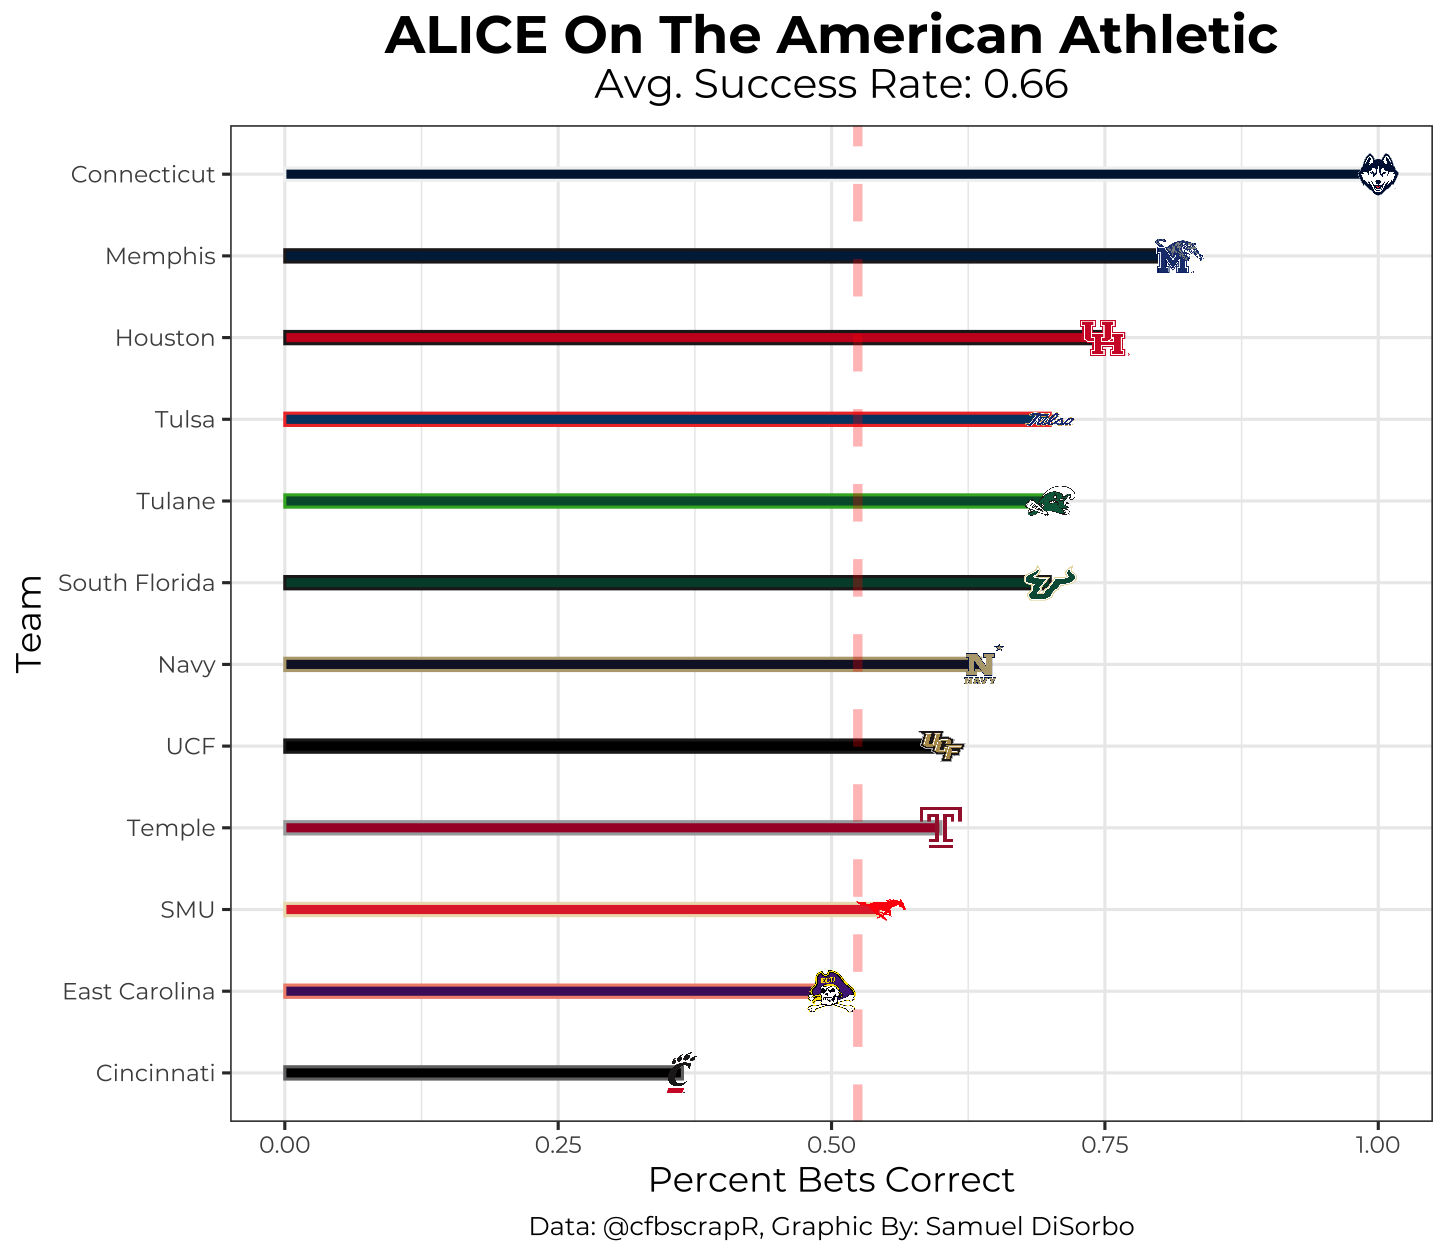
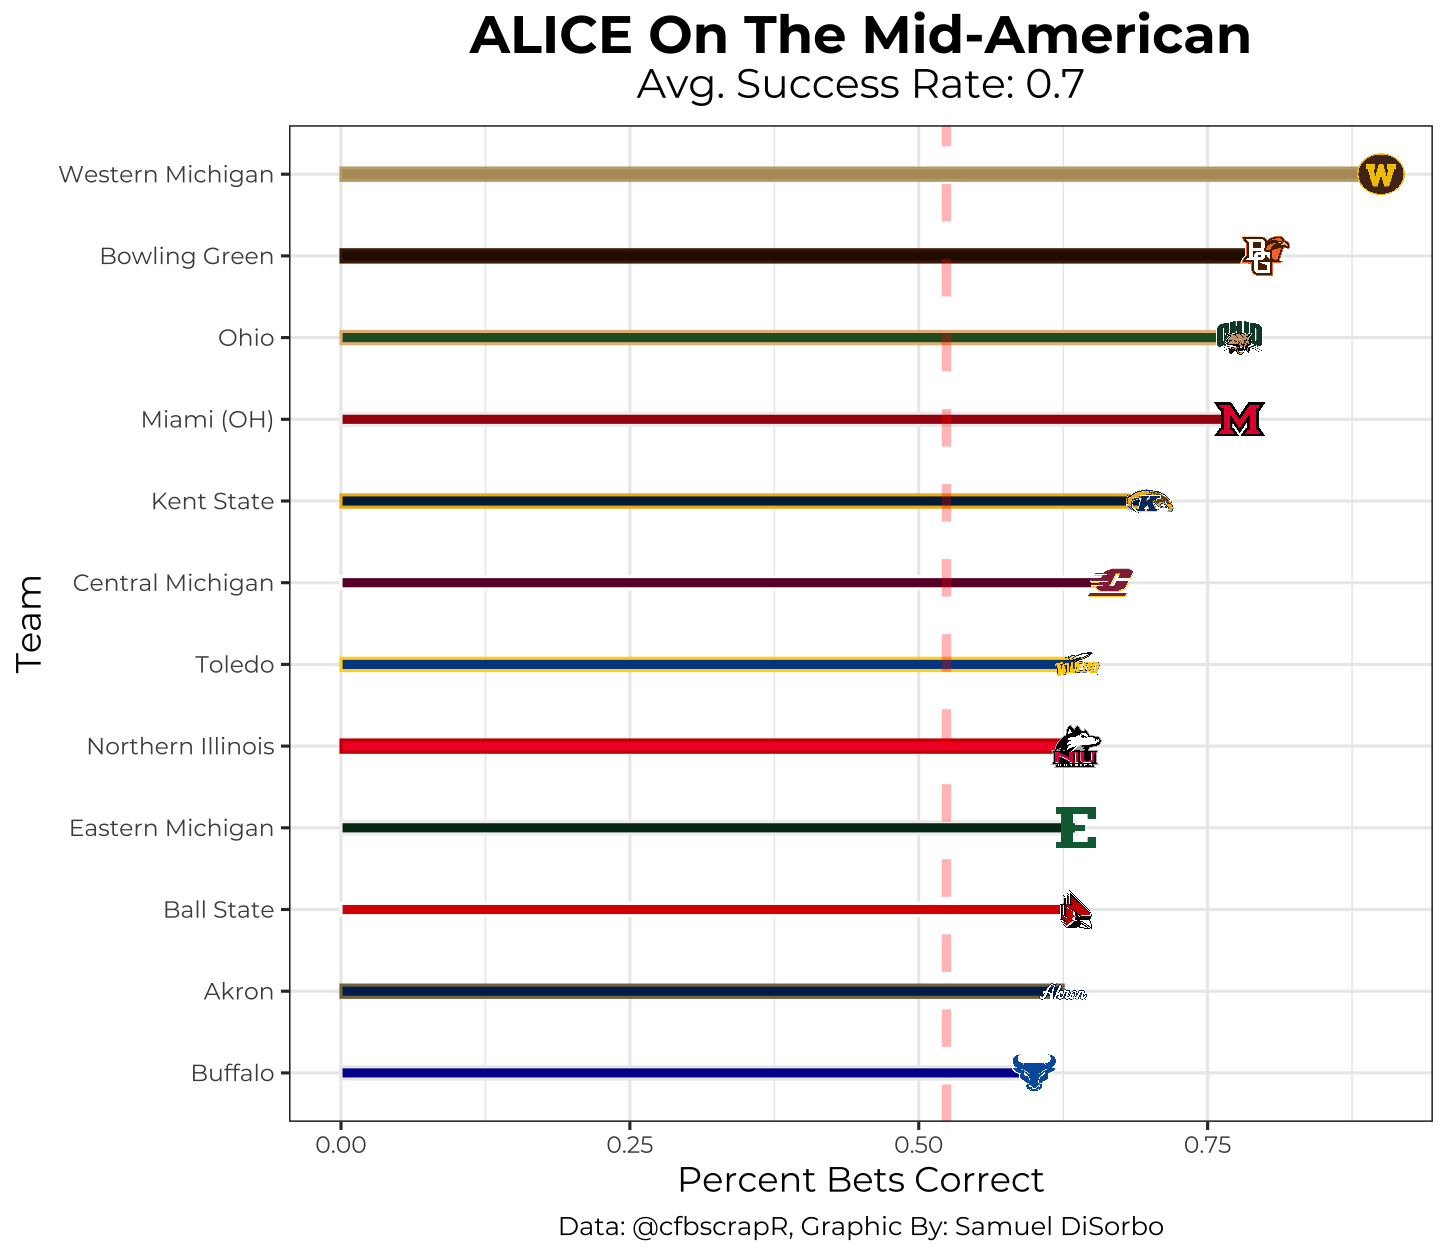
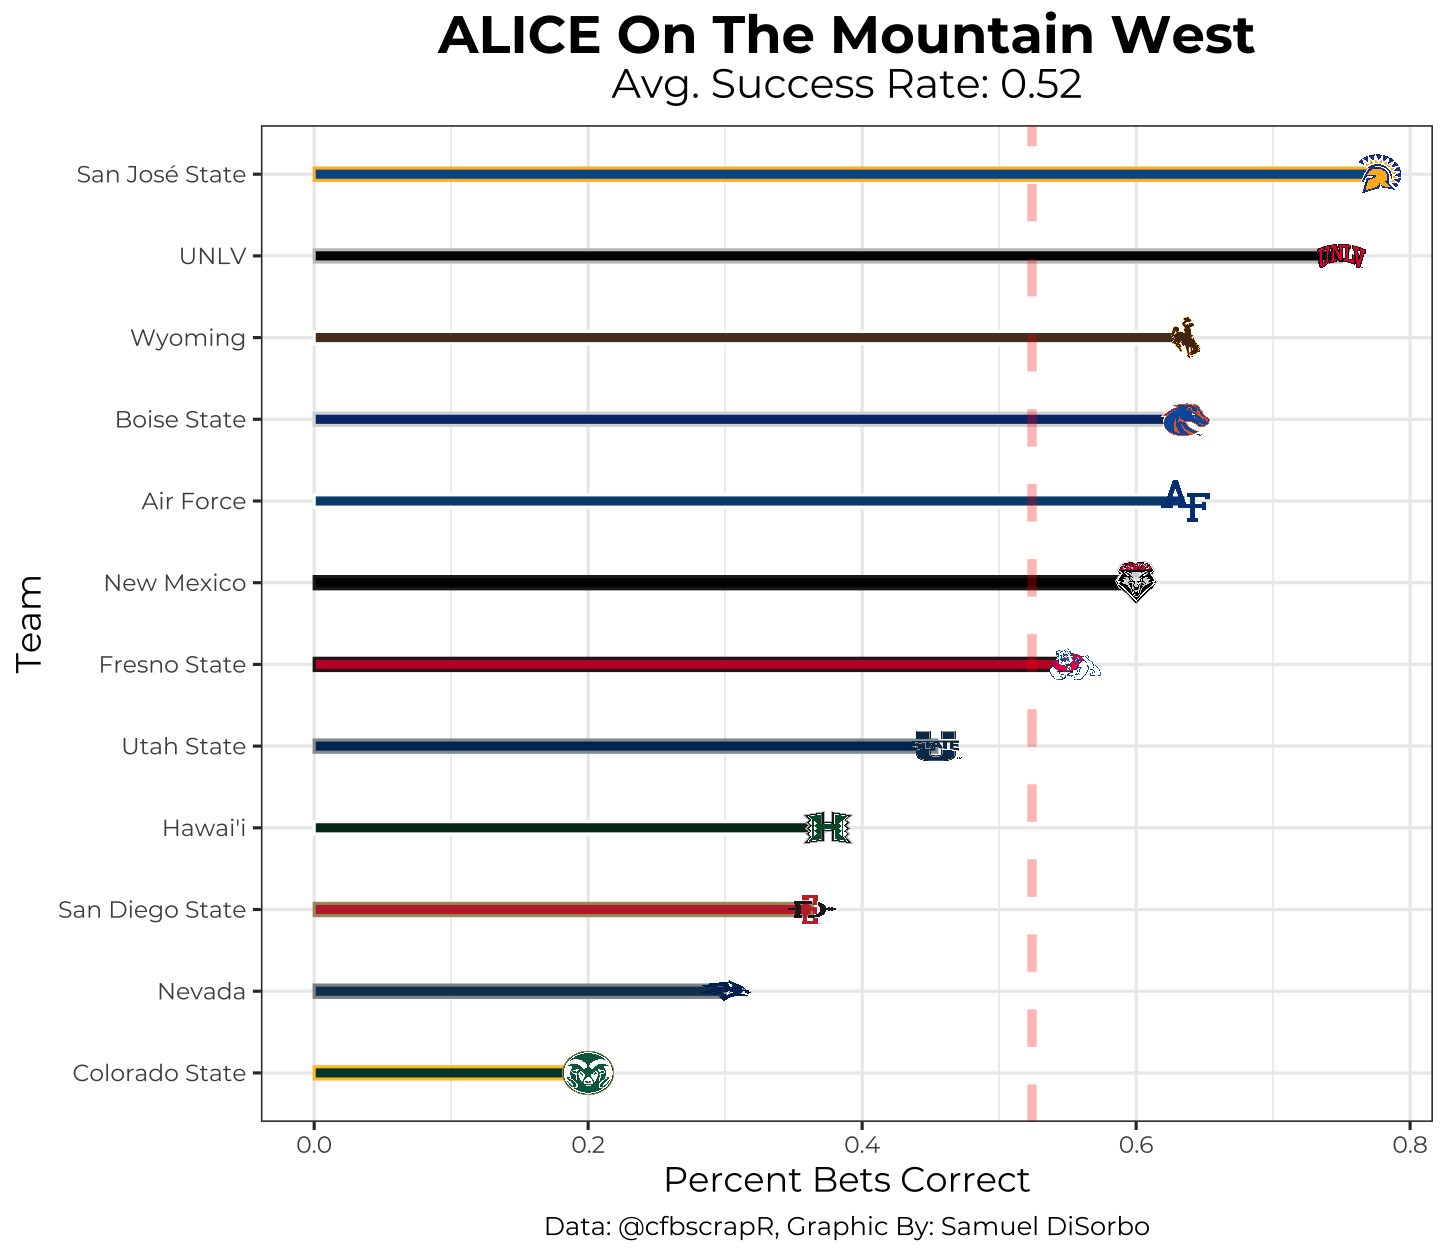
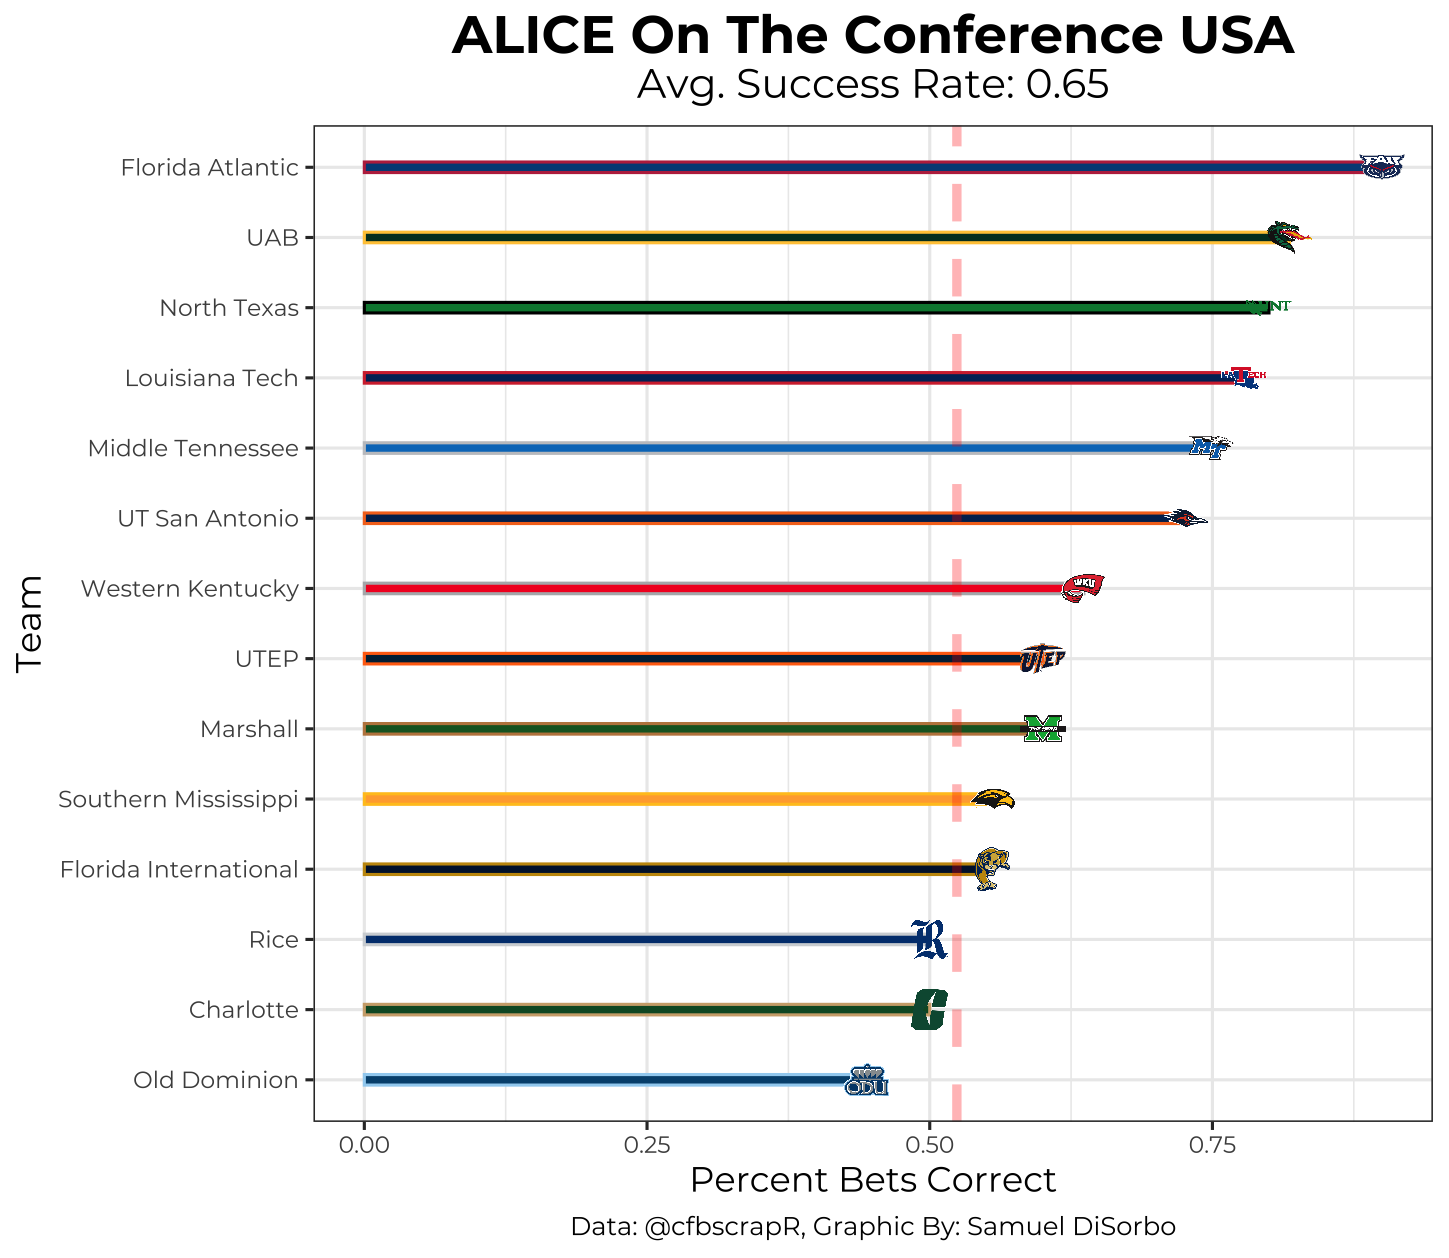
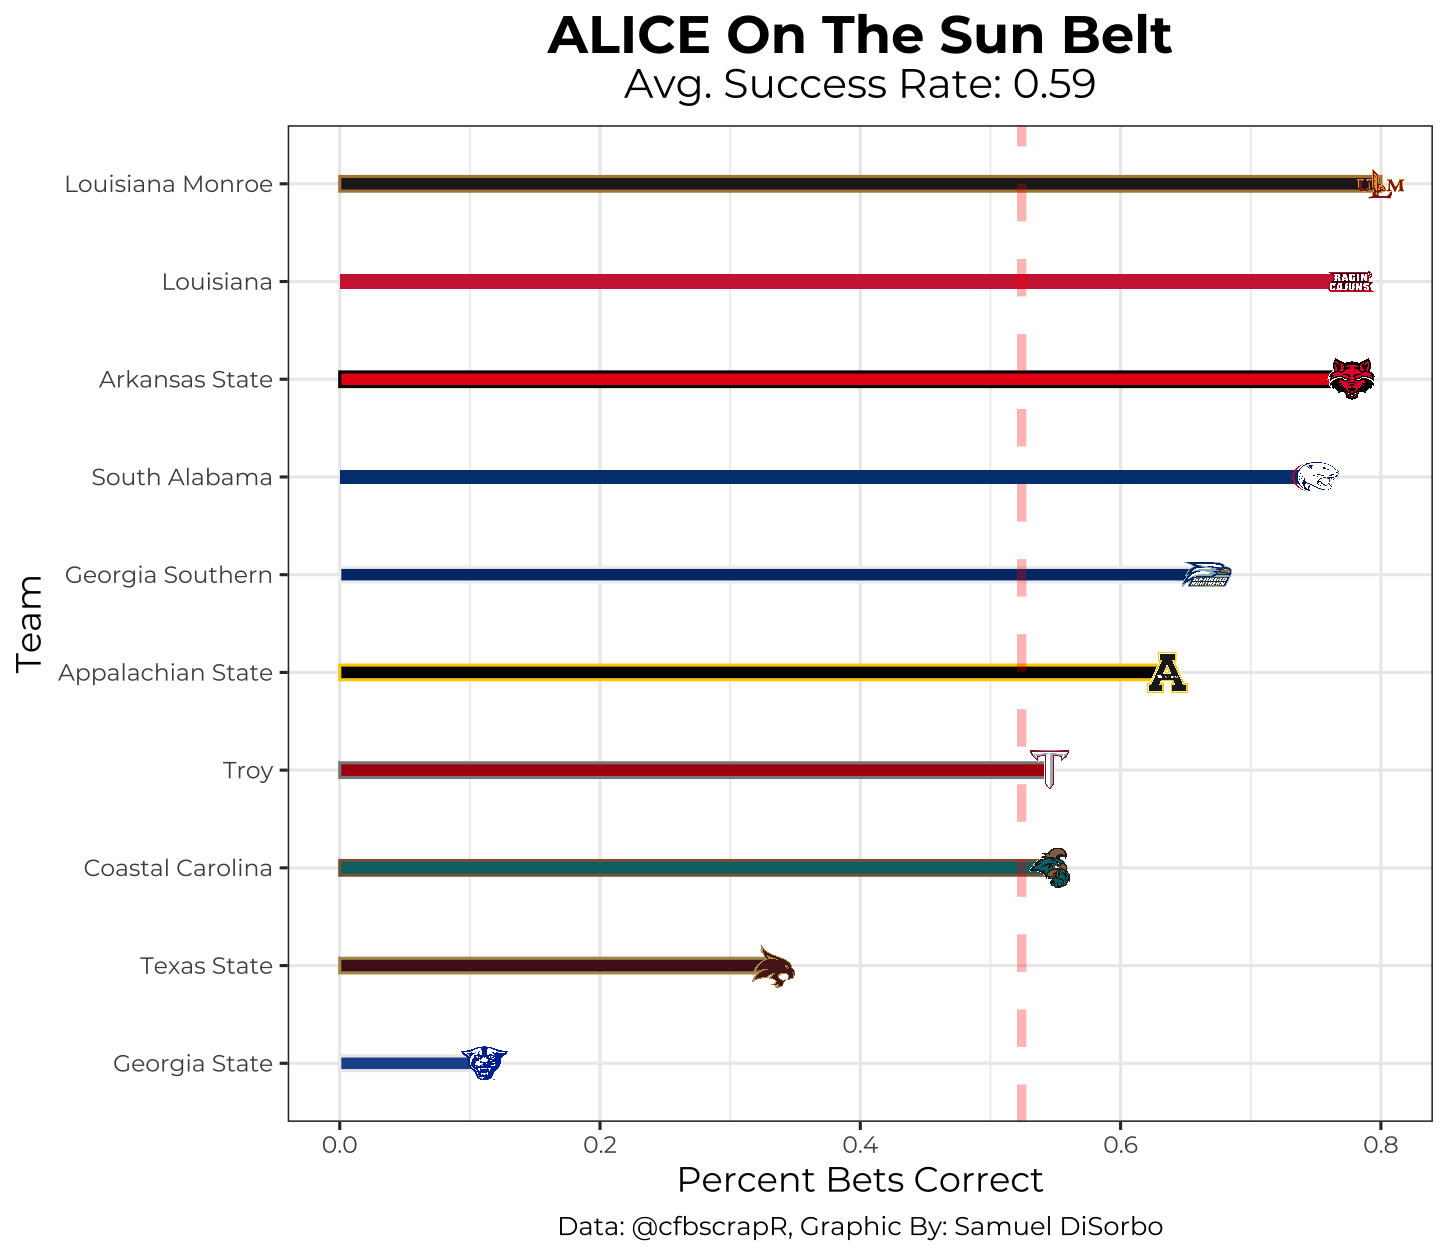
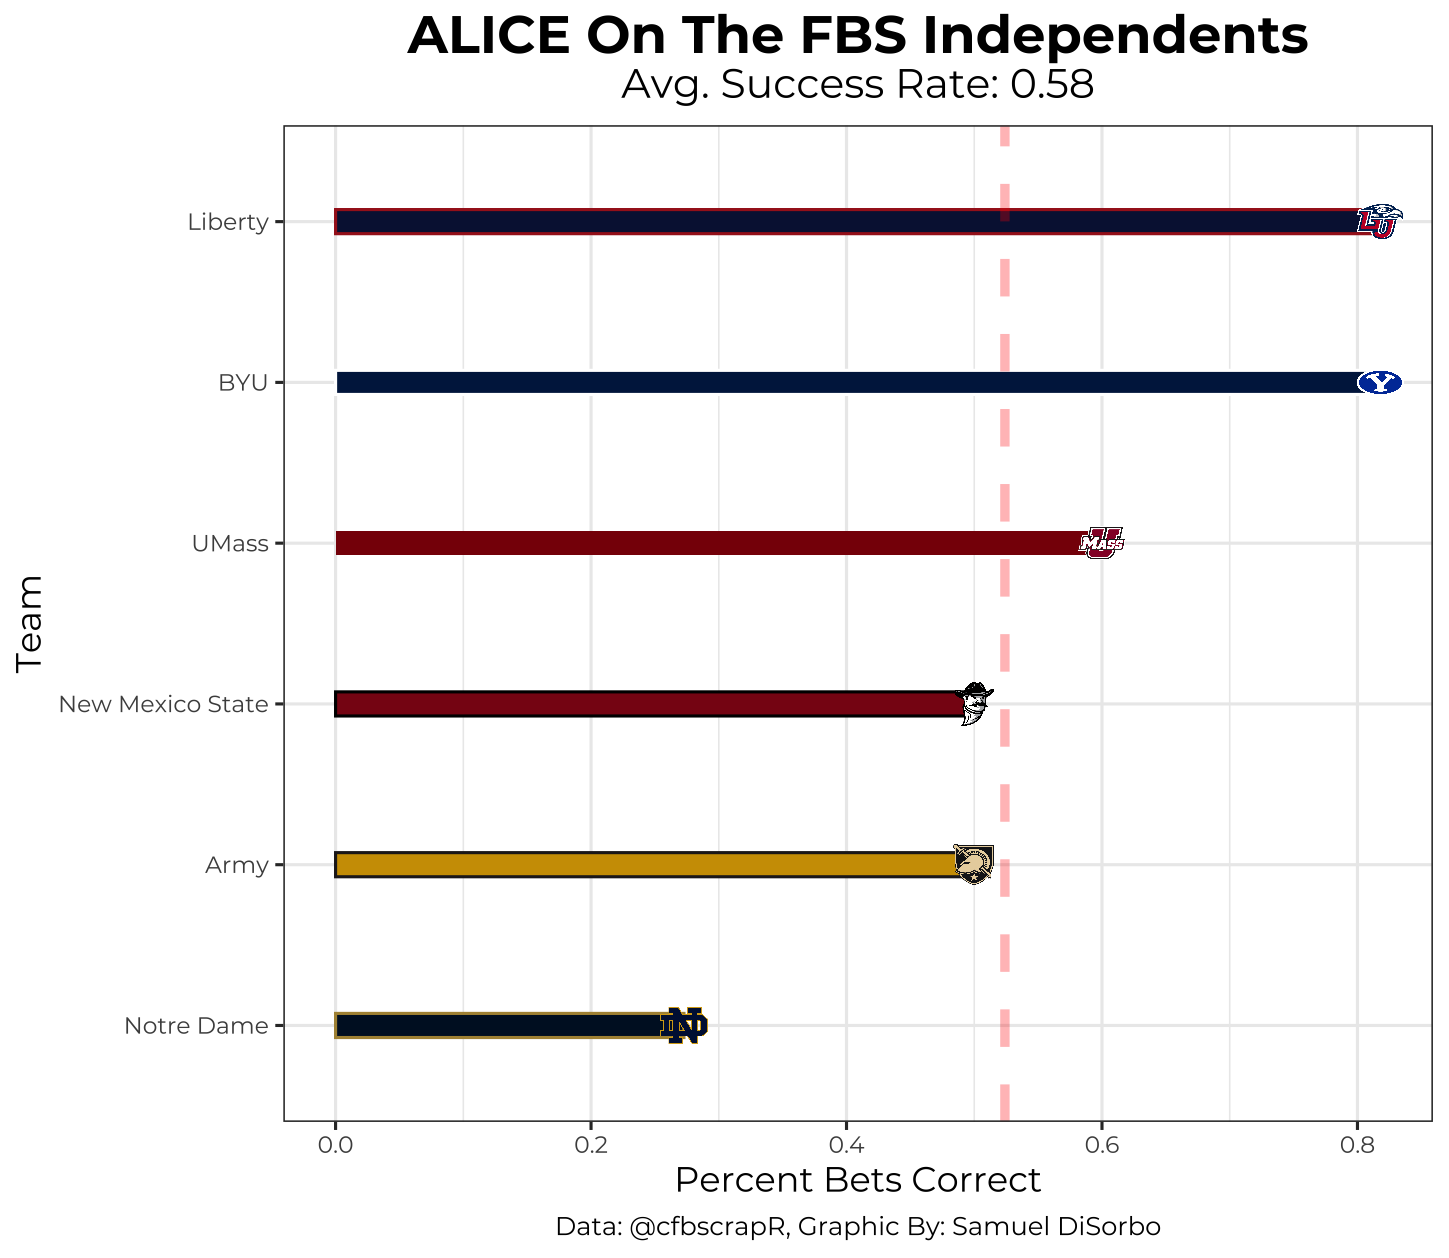
ALICE Performance by Division
Let’s now take a look at ALICE’s 2021 performance by division. One interesting discrepancy to note is that ALICE only has an average of 53.4% accuracy with Power-5 schools, while it has an average of 61.7% accuracy with non-Power-5 schools. This might be due to non-Power-5 schools generally having less talent and therefore being more evenly matched–this makes for slightly less variation and higher success rates for our model.
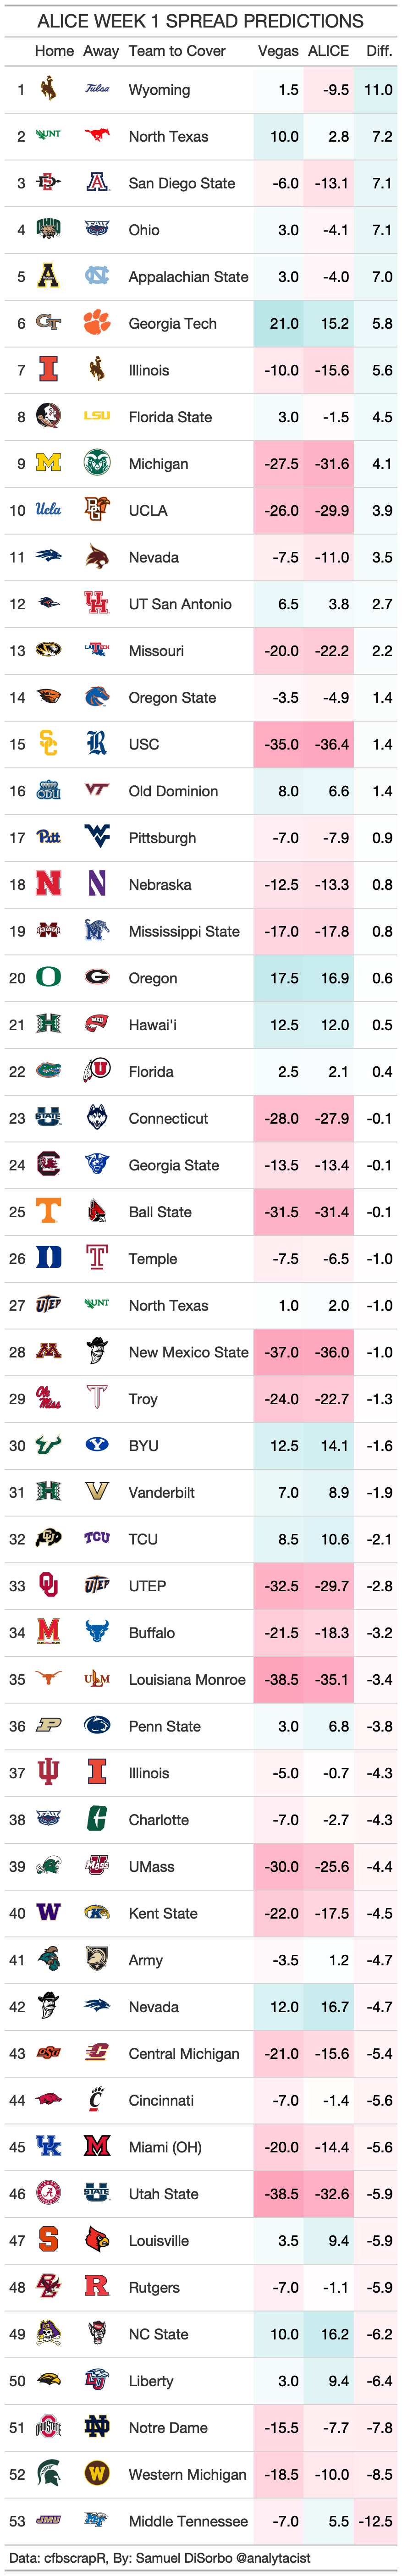
2022 Week 1 Predictions
The moment we’ve all been waiting for…ALICE’s 2022 week 1 predictions! Keep in mind: the spreads are based on the home team. This means if the spread is 10, we expect the home team to lose by 10, and if it is -10, we expect the home team to win by 10. Also, bear witness to the fact that ALICE performs best when predicting the away team will cover and when the difference between spreads is large!
That is all for this article! Stay tuned each week for ALICE model tweaks and predictions! As always, feel free to reach out to me on Twitter @analytacist! A lot of work goes into creating these models and I would be more than happy to answer any of your questions! Cheers to the upcoming season!
