
Researched by Joey DiCresce and Tej Seth
So what statistic is the best to use when judging the performance of the most important position in sports? What should NFL front offices, bettors, and fans on twitter use when trying to evaluate and predict quarterback play? In this article we will dive into these questions and judge 10 various stats.
Our Method
We gathered data from the past 5 seasons from all QBs who played in more than 7 games in a given season, coming out to a total of 56 QBs and 156 total individual seasons. We will be judging the statistics mainly based off the following criteria
- Relationship with Wins
- Year to year stability/consistency
- Ability to predict future wins
- The statistic’s formula and logic behind it
To do this we found the correlations and r-squared (correlation squared) of the relationships between the statistics themselves and win percentages for the same season and future seasons. Correlation is used to describe the strength of a linear relationship between two data sets and r-squared is a value representing the proportion of variation in one variable caused by the other. So an r-squared of 0.50 between a dependent variable y and independent variable x means that 50% of the variation in y is caused by x.
The assigning of wins to QBs has been much discussed throughout NFL circles. Thankfully, we have already discussed the reliability of QB wins here. Also while a win by itself is not the be all end all, looking at things that a QB can control and that are related to more wins gives us a measure of value.
The Stats
Here is a description of each of the stats we will be analyzing (EPA and QBR data from espn.com)
1 Expected Points per Play (EPA): EPA means difference in expected points caused by a play. Expected points are based on historical mathematical chances a team will score based on the field position and down. For example, the expected points before a 1st and 10 from midfield is about 2. A 10 yard gain would result in a 1st and 10 from the 40 for an EP of about 2.5, meaning the previous play has an EPA of 0.5. EPA is great at eliminating the value of empty yards, a 9 yard gain on 3rd and 20 isn’t actually very valuable but for stats like passer rating and total yards, that play is just as valuable as any other 9 yard gain. EPA takes into account all plays impacted by the QB, so all attempts, sacks, scrambles, and QB runs are included.
2 Passing Expected Points per Dropback (PASS EPA): PASS EPA per dropback will be referred to as simply PASS EPA in this article and is calculated by taking the EPA from all attempts and sacks divided by non-scramble dropbacks. (EPA from passing and sacks with scrambles and QB runs not included).
3 ESPN QBR: Not to be confused with passer rating, QBR is a stat created by ESPN, here is their explanation, ESPN QBR Explained. Basically, QBR is based on total EPA, but attempts to eliminate factors outside of a QBs control by dividing credit between the QB, OL, and WRs based on the amount of yards the pass travels in the air and the yards after catch. However the exact formula behind this is not given.
4 Completion Percentage (CMP%)
5 Yards per Attempt (YPA)
6 Touchdown Percentage (TD%)
7 Interception Percentage (INT%)
8 PFF Grade: Pro Football Focus grades every play of every NFL game. A player receives a grade from -2 to 2 every play. We are looking at QBs season grades. See PFF Player Grades for more info.
9 Passer Rating: Scaled from 0 to 158.3
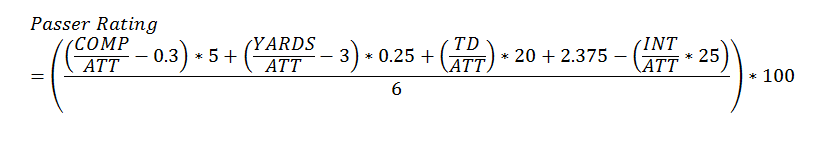
10 Adjusted Net Yards per Pass Attempt (ANY/A): A stat from profootballreference.com which represents the value of TDs and INTs as a certain amount of yards. The formula is:
(Passing Yards – Sack Yards + (20 * Passing TD) – (45 * Interceptions)) / (Passes Attempted + Times Sacked)
Relationship with Wins
As discussed above to find the relationship between the stats and wins we found the r-squared between the stats and the QBs win%. A higher r-squared means that a certain stat is more influential in whether a game is won or lost and therefore more important. For example, here is the graph of EPA v Win% in the same year, graphs like these are how we found the r-squared values.
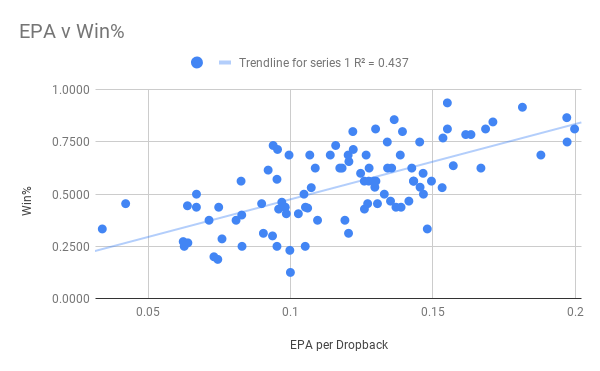
We can see higher EPA per dropback is associated with better win%.
Then, the graph below displays the r-squared values for all of the stats.
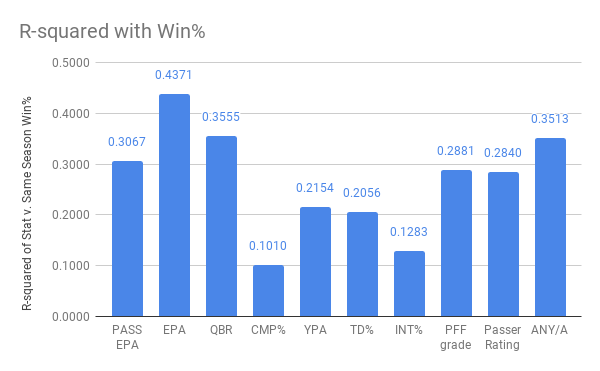
EPA is the best at explaining how a QB played in a given game because EPA demonstrates a contribution to winning a game better than any other stat. QBR and PASS EPA both have stronger relationships as well which makes sense given their similarity to EPA. ANY/A, PFF grade, and passer rating have stronger relationships too. Notice how TD% and INT% do not have as much of a relationship. This weakens the argument that using TDs and INTs is not always a great way to measure QB play. TD% and INT% only account for about 2-8% of the throws a QB makes and does not take sacks or rushing into account at all. It makes sense that the stats that are a compilation of all facets of the game and include more plays are more indicative of win%. In a game with a tremendous amount of moving pieces and variables it is amazing how much of an impact the QB position has. For singular stats of one position to have this strong of a relationship with win% is amazing in itself and just goes to show the QB is the most important position on the field by far. However, evaluating play in a singular game or season is important, but does it consistently tell us who the best QB is, or just who played the best in a given game or season?
Stability and Reliability
Stability matters a lot. If a stat is not stable we can not use it to predict future play as well as a stable stat. We measure stability by finding the r-squared values between a QB’s stat in a given year vs. the same QB and same stat in the next year. So for YPA one data point is (QB-A’s YPA in 2017, QB-A’s YPA in 2018) and another would be (QB-A’s YPA in 2018, QB-A’s YPA in 2019).
The graph below displays the year to year stability of each stat.
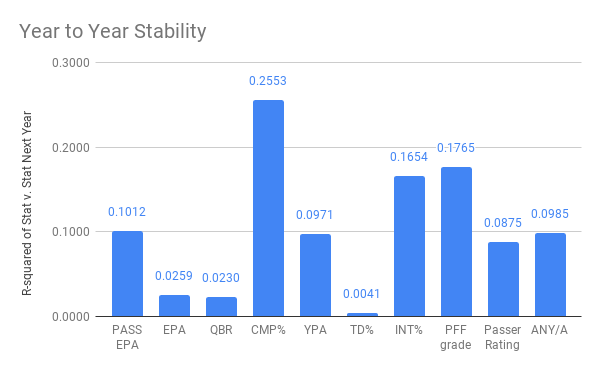
Notice how most of these stats are not very stable, football is a game with lots of variance year to year. CMP% is the most stable stat but this doesn’t really matter because of how little of a relationship it had with wins. CMP% more than anything just reflects scheme and QB’s tendencies. EPA and QBR are also unstable which makes sense because the stats take into account more variables than any other stat. The stability of PASS EPA is a major strength, and shows how a QB’s rushing ability is less stable and more subject to change year to year than their EPA on pass plays. TD% has basically 0 correlation with future TD% and just goes to show that TD% is more based on luck and play calling in the redzone than an actual QB’s ability, because if it was an indicator of a good QB, we would likely see similar TD% from year to year from those good QBs.
Predicting Future Success
Predicting future success is a combination of both importance and stability. The graph below displays all of the stats’ r-squared values with a player’s win% in the next season. This is useful because it lets us know what statistics from a previous season are useful for predicting future success. We also found each of the stats ability to predict one another in future seasons. Most of the r-squared values seem rather low, but football is difficult to predict and is a game of many moving parts. For comparison, in our dataset, a QB’s win% r-squared with future win% was only about 0.07.
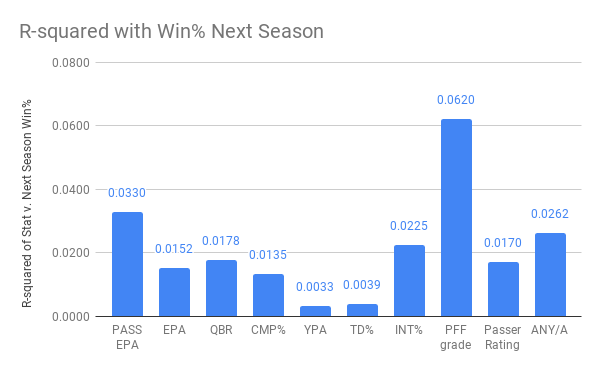
PFF grade clearly stands out as the best predictor. Predicting future win% is determined by a mix of a statistic’s importance and stability, so this shows that PFF grade is a good stat because it is important, and stable, so the fact that the data shows it is a good predictor is valid. An opposite of this would be INT%, which is a slightly better predictor than EPA and QBR but from looking at r-squared values with current season wins we know how much more important EPA and QBR are. They are not as good predictors because they are unstable year to year. Basically some stats are better at evaluating current play (EPA and QBR) and some are good at evaluating current play and also good at indicating future play (PFF Grade and PASS EPA).
PFF Grade is actually a better indicator of future EPA than current EPA. This further displays the usefulness of PFF Grades for indicating good QB play and predicting future QB play.
Process/Formula Quick Points
Stats that involve the most amount of plays are the best at evaluating past play, although this usually means the stats are less stable.
- Stats that include sacks are better than those that do not.
- Passer rating’s formula seems pretty subjective and doesn’t include sacks or factor down and distance but it does combine TDs, INTs, CMP% and YPA which is better than any of those stats just on their own.
- PFF Grade has a good process. PFF graders have very strict guidelines and grade every single play. Yes there is subjectivity in those grades but the amount of data that goes into each grade makes a little bit of subjectivity on a few plays not important. The data reflects that for QBs, PFF grades are a good stat.
Final Verdict / TL;DR
Top Tier
EPA: Most important, not stable, fine predictor, best process/formula
PASS EPA: Important, more stable, good predictor, great process/formula
QBR: Very Important, not stable, fine predictor, great process/formula
PFF Grade: Important, most stable, best predictor, great process/formula
ANY/A: Very Important, more stable, good predictor, decent process/formula
Kind of ok
Passer rating: Important, somewhat stable, fine predictor, bad process (subjective, no context applied).
Not Good on Their Own
YPA: not important, somewhat stable, zero prediction
INT%: not important, stable
Garbage almost always
CMP%: Irrelevant but stable
TD%: Not important, zero stability, zero prediction, terrible process
To find all of our articles as soon as they are released follow us on Twitter! @mfbanalytics
Follow me on Twitter! @joey_dicresce
Follow Tej on Twitter! @Tej_seth41
