
In light of Eli Manning’s retirement what qualifies as a Hall of Fame QB has been brought into the limelight of sports media debate. Every time we see a return of Hall of Fame debates we see one contentious stat being brought up: QB wins. But do QB wins matter in determining how good a given passer was?
Personally, I have always hated the QB wins argument because football is the ultimate team sport. Therefore, wins should be considered indicative of team success, not just the performance of a single player. So, I decided to do what any frustrated vindictive and frustrated person does, and I performed a statistical analysis. I looked at every QB who was the primary starter for a team during 1998-2018, a total of 174 QBs, and tried to answer two questions:
1. Are wins more indicative with QB performance, or a team’s talent?
2. Is QB performance more correlated with wins, or their team’s talent?
It is important to note that if any QB qualified as a primary starter and had started any season before 1998, those seasons were considered. For example, Troy Aikman, Steve Young, and Dan Marino all started many seasons prior to 1998, and thus those seasons were considered. This was in order to mitigate the effects of a single bad season from a good QB at the end of their career on the whole data set.
This presents several issues right off the bat: how am I going to quantify QB performance and how are we going to quantify talent on a team? For QB performance we will be using Adjusted Net Yards per Attempt (ANY/A) which is roughly how many yards a QB gains per drop back. ANY/A is by no means perfect. It doesn’t account for rushing, and it heavily punishes interceptions. This means that QBs who were great on the ground, like Michael Vick, and were gunslingers, like Brett Favre, do not score as well by this metric. For a quick snapshot of a passer, however, it is good enough to say if a passer was generally good, bad, or average. Another issue is that between 1998-2018 the NFL has been much more prolific passing the ball, evidenced by the increase in average ANY/A.

This means that Brett Favre’s ANY/A of 6.07 in 1998 is much more impressive than Sam Bradford’s 6.10 in 2013 because it was much higher than the league average. To overcome this discrepancy, I will be using the era adjusted statistic ANY/A+. ANY/A+ compares the player’s ANY/A to the league average and is centered at 100 where high is better. In our earlier example, Brett Favre has an ANY/A+ of 110, 10% better than average, while Sam Bradford has 102, 2% better than league average, and is thus more impressive.
Now we must overcome the second, larger hurdle: how can we quantify the overall talent of a given team? To answer this question, I am going to make several assumptions:
1. If a player makes the Pro Bowl, he is talented. There are snubs and there are occasionally players who don’t deserve to make the Pro Bowl who make it (See: Rhodes, Xavier). However, I’m going to assume that the number of undeserving players is negligible.
2. If a position coach or coordinator was a head coach or would become a head coach, they were good at being a position coach or coordinator. For example, even though Jim Tomsula was a bad head coach, I’m going to assume he must have been a good defensive line coach to get that chance.
3. A head coach with a better winning percentage takes better advantage of the talent on the roster and the coaching staff. This means a very talented team is still good with a bad head coach, but it is even better with a great head coach.
4. Head coaches can get more or less effective over time. In other words, a coach’s career wining percentage is not indicative of how effective they were at every point in their career. For example, George Seifert won at least 10 games every year he coached the 49ers, but never had a winning record with the Panthers. Therefore, it would not be fair to apply his career winning percentage to his time with the 49ers.
From these assumptions we can create a simple formula for how much talent is on a team. I am going to quantify Talent (TAL) as
TAL = (Year to Date HC Win %)* (# of Pro Bowlers + # of Future/Former HCs)
An important note is that the future or former head coach count does not count the current head coach. The year to date head coach win percentage is the win percentage of the coach from the beginning of their career to a given year. For example, Steve Mariucci at the start of 1999 had a Year to Date winning percentage of 78.1%, but at the start of 2005 it was 53.1%. This is to consider that coaches can get more, or less, effective with changes to the overall NFL landscape.
This is imperfect as it does not account for great position coaches and coordinators who were never head coaches (Donte Scarnecchia, Jim Johnson, etc) and counting Pro Bowlers is not an ideal measure for roster talent. This metric, however, should give a good idea for how talented a team’s roster and coaching staff are. For reference, league average for TAL over 1998-2018 is 2.76.
We now have the metrics we need to answer the questions we first set out to. But first, some quick statistical background, the number we are worried about in the graphs that follow here is which tells us how well correlated two variables are. This doesn’t mean that one variable causes another, but rather what tends to happen to happen to one variable based on the other. In other words, it measures how strongly one variable tends to change when another variable changes. For our purposes, if
is greater than or equal to .5 the variables are correlated, if it’s more than .8 they are strongly correlated, and if its less than .3 they are not correlated. With this in mind, let’s see how well wins are correlated with QB performance and team talent:
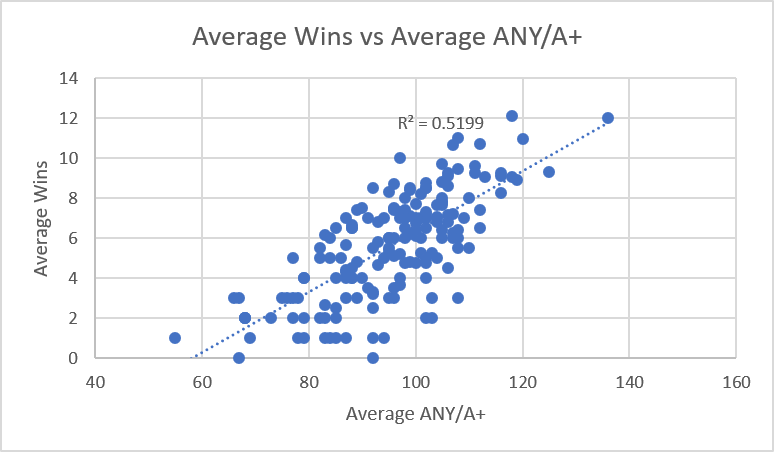
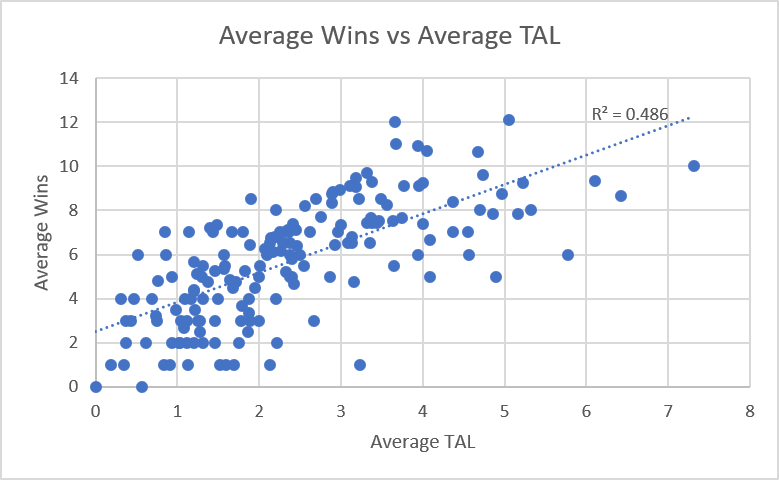
In a surprising turn of events, it turns out the average amount of games a QB wins are correlated more strongly with QB performance than it is with overall talent. It would be extremely irresponsible to draw a causal link from this (that is, better QBs cause teams to win more games), however the correlation is undeniable. It is not more correlated by a wide margin, however. For our purposes, a .486 is not significantly enough different than .5199
to draw any large conclusions. So to answer question 1: Wins are more indicative of good QB performance than a talented team, but not by much.
A natural counterargument to these results is that the team’s talent is a confounding variable. In other words, a QB will perform better, and thus win more, because the team around him is better. That leads us to Question 2. We can graph QB performance against their team’s average talent and their average wins, and see which it is more correlated with:
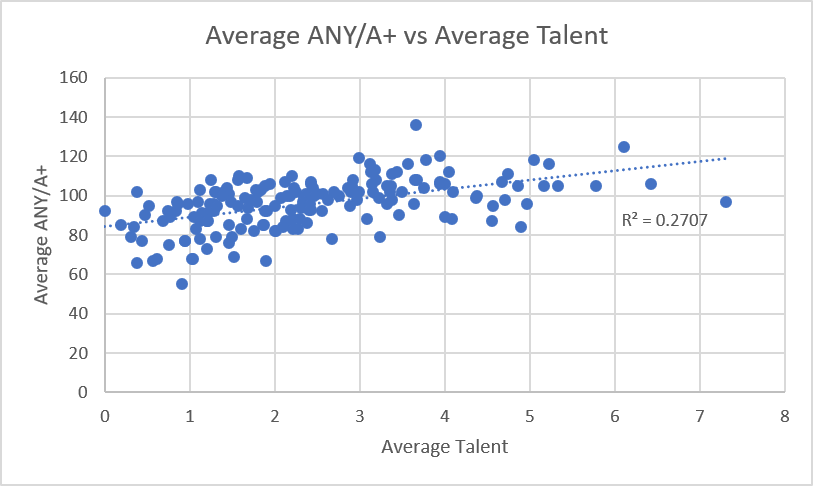
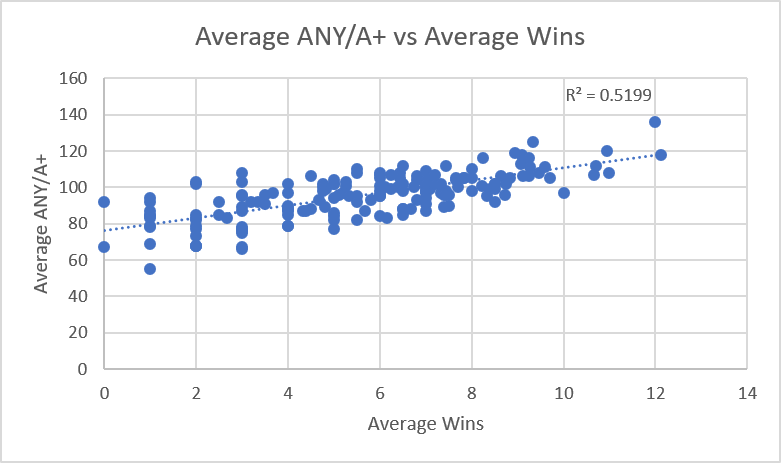
Surprisingly, it is not even close. A QB’s average performance is barely correlated with how good his team is, while it is definitely correlated with how many wins he has on average in a season. This suggests that QB performance is largely independent of his supporting cast, and that a good QB will likely win more regardless. So, to directly answer Question 2: QB performance is much better correlated with wins than it is team talent. The independence of a supporting cast on a QB’s performance is an incredibly difficult claim to draw from this data, however it is on a cursory level supported.
In a short summary: How many games a QB wins is slightly more correlated with how he performs than how talented his team is, but a QB’s individual performance is much better correlated with how many games he wins than how talented his team is. In layman’s terms, a better performing QB will win more than a worse performing QB, even if the worse QB has a more talented team around him.
Several counterarguments still do naturally arise from this data: better QBs should win more playoff games and super bowls, and thus performance should be strongly correlated to those. Even more so than team talent since only ELIte QBs win Super Bowls. These questions are out of the scope of this article, but will be addressed next week, as will the Eli question.
