Throughout my life, I really have only played two sports competitively: Basketball and Cricket. While I loved to watch football, my parents didn’t allow me to play given that I was a skinny teenager. However, that didn’t stop me from playing flag football or two-hand touch with my friends. I found myself playing at receiver and cornerbacks most of the time, which I really enjoyed. I began to love the art of playing WR, and that has been my favorite position to watch in the NFL as I noticed the different styles of receivers. I dive into that in this article.
Almost every NFL team carries about 5-6 WRs on their active roster. To build a successful and efficient offense, you need to have WRs with different skill sets that complement each other. To cluster NFL WRs, I utilized K-Means Clustering which takes a set of variables and puts it into a model to match WRs together. These variables are important because it can help to find which WRs are the most similar in terms of their playstyle and stats. I followed Alex Stern’s excellent tutorial to be able to do this. These were the variables that I used in my cluster analysis:
- Yards After Catch per Reception (YAC/R)
- Average Depth of Target (ADOT)
- Yards per Reception (Y/Rec)
- Yards per Route Run (Yards/RR)
- Slot Rate
- Drop Rate
- Contested Receptions
I felt that these variables would do a good job distinguishing which WRs stood out from one another, and which players were the most similar. After using these variables, I created 6 clusters of NFL WRs.
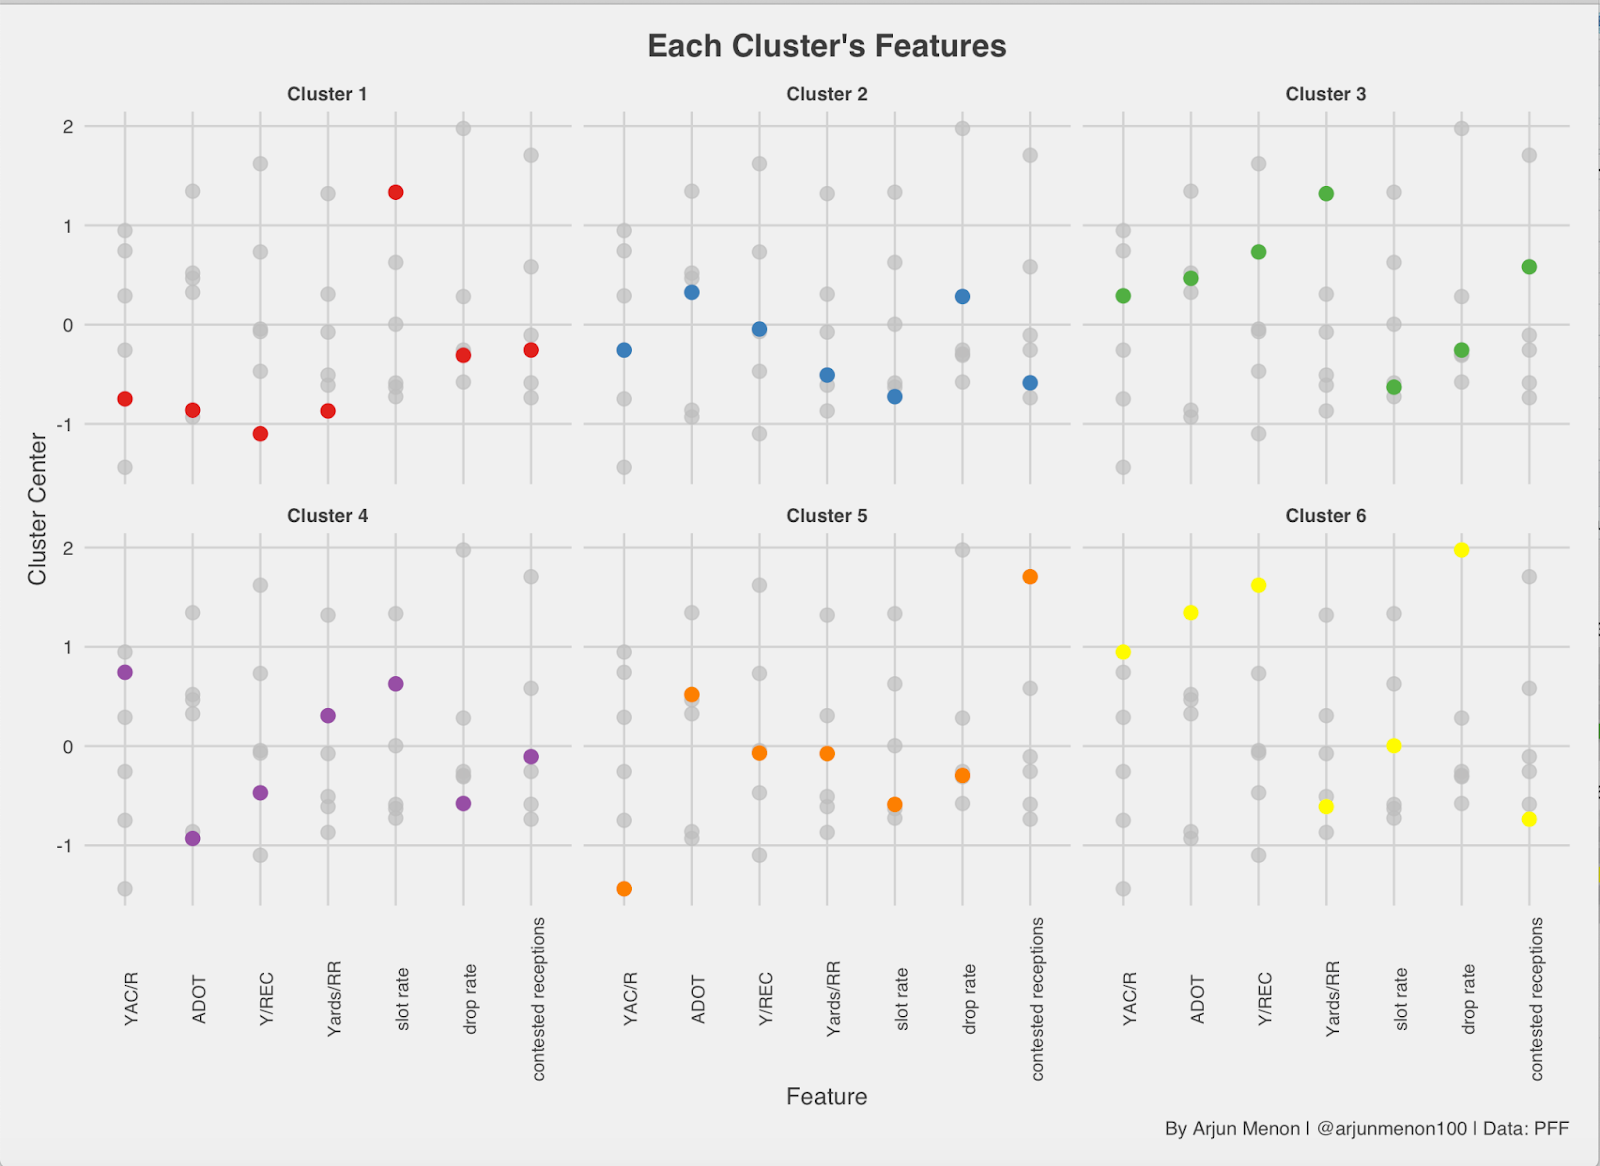
And here is what each Cluster contains:
- Cluster 1: “Slot Guys”
- High Slot Rate
- Low Yards per Reception
- Low Average Depth of Target
- Cluster 2: “Do it All Guys”
- Low Slot Rate
- Low Contested Receptions
- Cluster 3: “The Studs”
- High Yards per Route Run
- Low Drop Rate
- High Yards per Reception
- Cluster 4: “Mr. Sticky Hands”
- Low Drop Rate
- High Yards After Catch
- High Slot Rate
- Cluster 5: “Probably Played Basketball Before”
- High Contested Receptions
- High Average Depth of Target
- Low Yards After Catch per Reception
- Cluster 6: “Boom or Bust”
- High Average Depth of Target
- High Drop Rate
- HIgh Yards After Catch per Reception
- High Yards per Reception
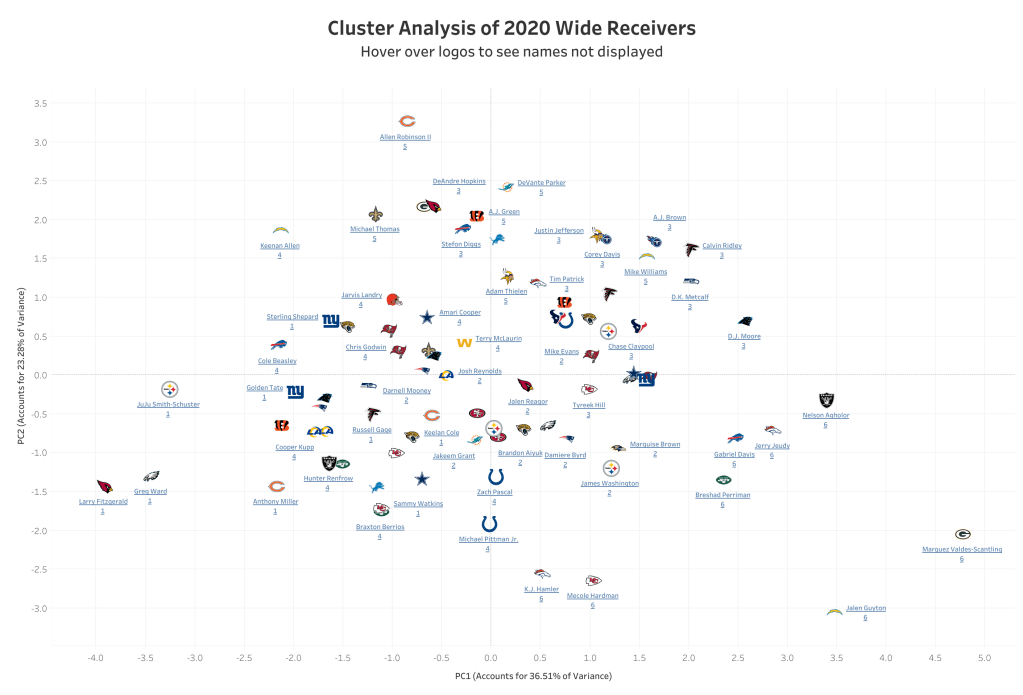
Originally, I had plans to make a tableau dashboard that would be interactive for the readers. However, wordpress doesn’t allow users to embed public dashboards on their website. If you want to check out the dashboard and see where certain receivers are use this link: https://public.tableau.com/views/NFLWRClustering/Dashboard1?:language=en-US&:display_count=n&:origin=viz_share_link
I used all wide receivers that had more than 50 targets in 2020. There were 84 players that fit this bill. I made the public tableau dashboard so you can see every player by simply hovering over their name, or the logo of the team they play on. You can also see what cluster they’re in by hovering over their name/logo as well.
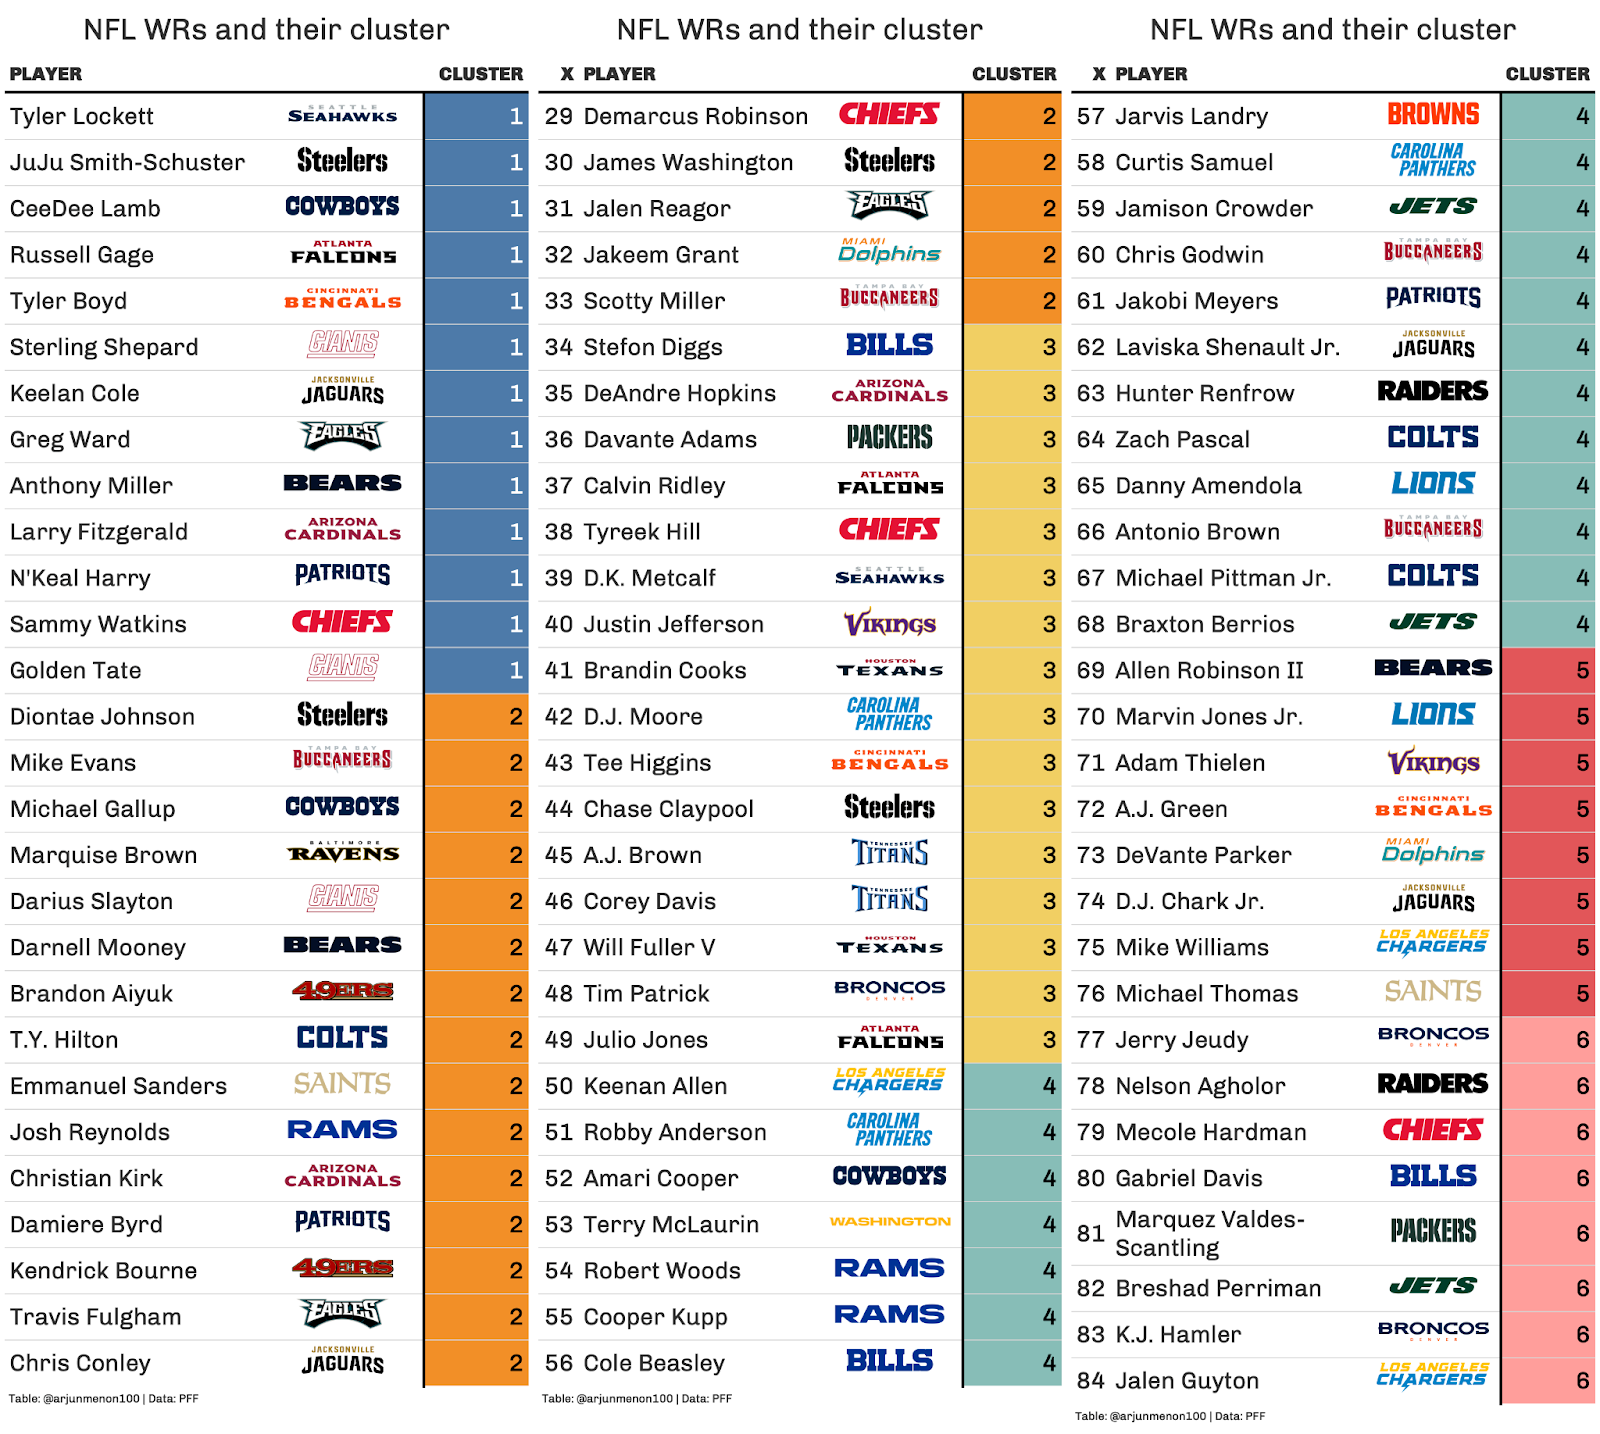
If you prefer tables instead of graphs, I provided this for you.
Let’s go through each cluster and highlight names that make sense based on the cluster features.
- Cluster 1: Since these are the slot guys, it’s good that we see players like Tyler Boyd, Ceedee Lamb, and Juju in here. These WRs are not field stretchers and instead act as a security blanket, hence their low yards per reception.
- Cluster 2: To be honest, this cluster is made of players who didn’t fit anywhere else. In the feature importance, Cluster 2 had no defining feature about it. Looking at the WR in Cluster 2, there doesn’t seem to be a whole lot of players who are the top guy on their team. Instead, it’s made up of WRs who are average in almost every single category.
- Cluster 3: I labeled this group the studs because that’s what they really are. Most of the top 10 WR’s in the league fall into Cluster 3 including guys like Davante Adams, Deandre Hopkins, and Tyreek Hill. These WRs are uber efficient, as they have a very high Yards per Route Run, and don’t drop the ball very often. These are the alpha WRs on their respective teams and it’s a good sign if your favorite team has a receiver in this cluster.
- Cluster 4: This cluster contains guys that don’t drop the ball very often. This makes sense given that the cluster has players like Keenan Allen, Jarvis Landry, and Robert Woods. Many of these players are very good after the catch which is also a staple of this cluster, which is a good sign.
- Cluster 5: All the guys in this cluster are above 6 feet tall. They also have a very high number of contested catches. Hence, they probably played basketball growing up. This cluster also confirms priors as players like Allen Robinson (bad QB play leads to more inaccurate passes, which leads to more contested throws), Mike Williams (insane acrobatic catches), and Michael Thomas (very accurate QB who can force throws into tight windows for Thomas to catch) all make up this cluster.
- Cluster 6: With the players in this cluster, you are either getting a 50 yard bomb, or a dropped pass. These are field-stretchers. Guys like Marquez Valdez-Scantling, Nelson Agholor, and Jalen Guyton were all deep threats for their respective teams, but also suffered from drops.
Now 84 WRs is a lot to take in, so I decided to take a look at every team’s WR1 from 2020, and see the range of distribution among all clusters.
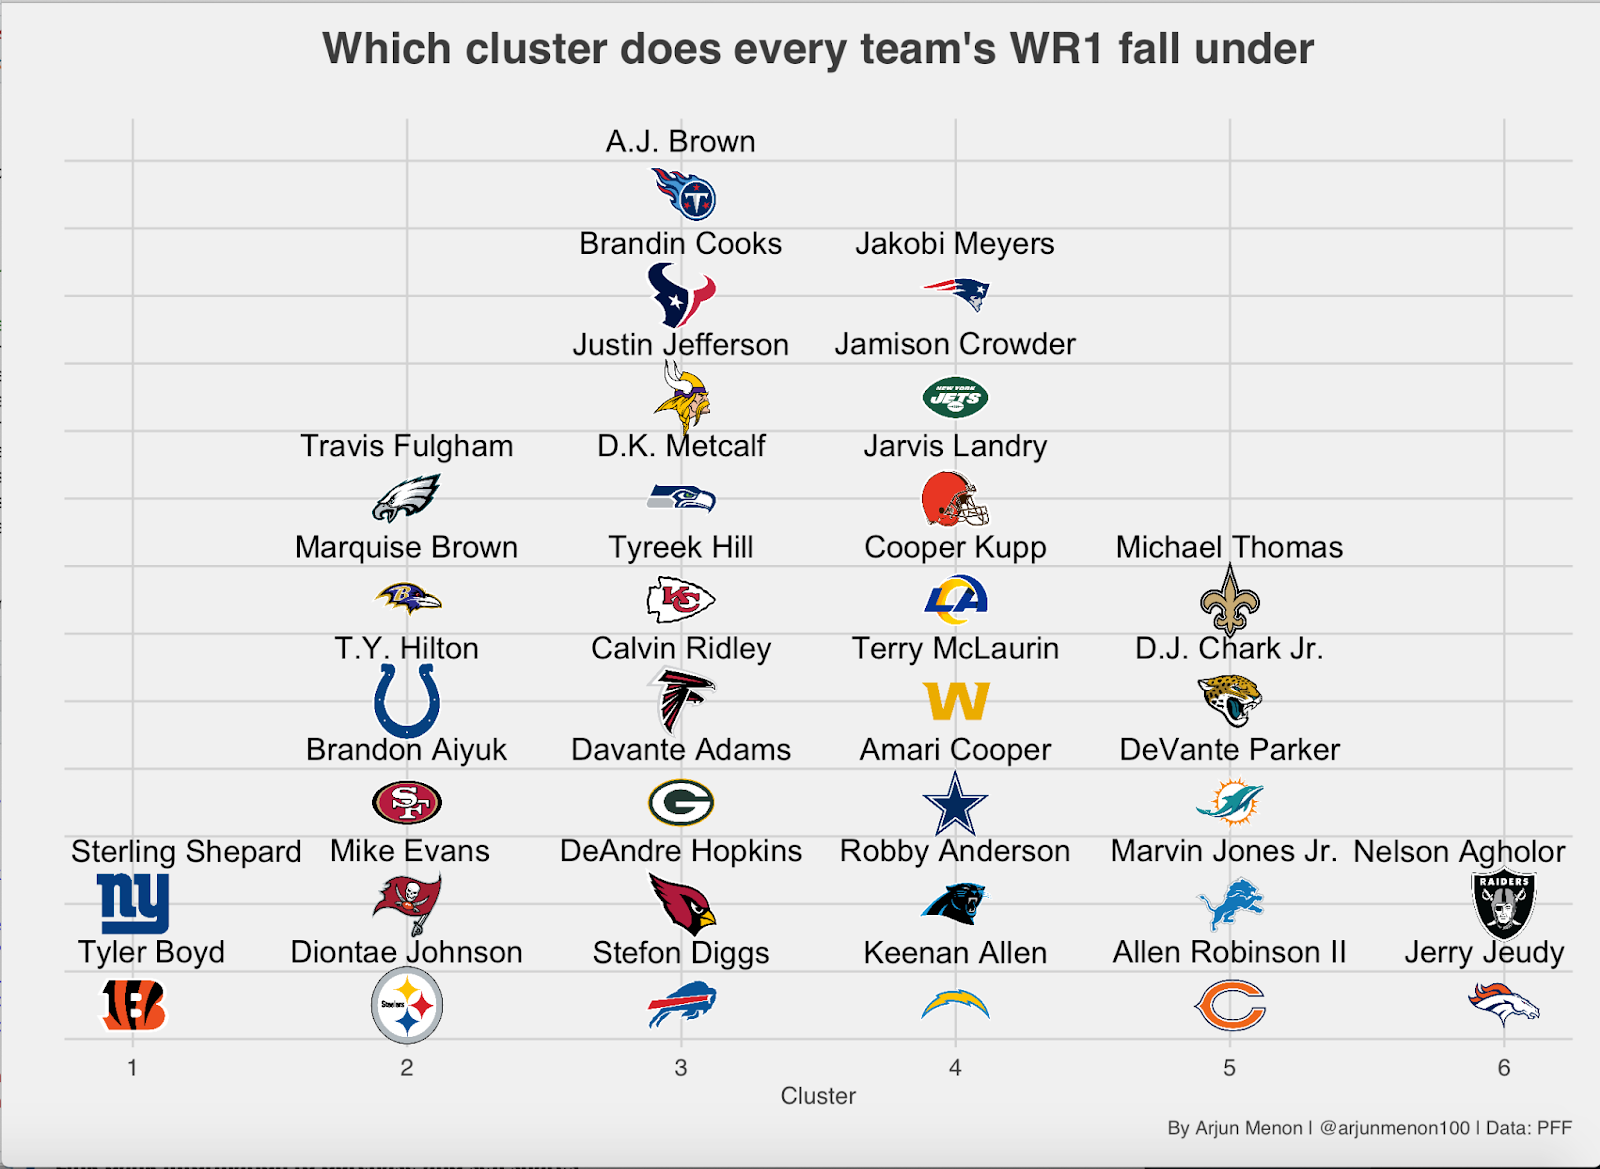
Many of the top receivers on teams fell into Clusters 2-4. Very rarely are the slot receivers the #1 guy, and deep threats are usually the second or third option, which is why there are only 4 receivers in Clusters 1 & 6 combined.
Well, that will bring us to the end of this article. I hope it was insightful and you had fun looking at the graphs and playing around with the tableau dashboard. Big shoutout to Alex Stern for his amazing tutorial which helped with the code to cluster these players.
Make sure to follow us on Twitter @mfbanalytics and myself @arjunmenon100
