The running back position is one of the hardest positions to evaluate in the NFL. The “running backs don’t matter” movement has brought down the value of running backs. On top of that, big contracts to rushers like Ezekiel Elliott, Todd Gurley II, and David Johnson have failed. It has been shown that the offensive line and number of defenders in the box contribute more to a successful rushing attack than the actual running back does. Last week, I clustered NFL WRs to see which players were the most alike based on a variety of stats. After that article was published, I wanted to find a way to compare running backs, and find which types of running backs were the most successful.
Similar to my article from last week, I utilized a K-Means Clustering model to cluster NFL RBs. The clustering model utilizes a set of variables to match RBs that are the most alike. Once again, I would like to thank Alex Stern for his very helpful tutorial (and big congrats to him for recently getting hired by my favorite team, the Chargers, as an analyst!). I also want to thank Tej Seth (@mfbanalytics), for making his Rushing Yards Over Expected (RYOE) model open to the public, which is where a lot of my analysis comes from. Without further ado, here are the variables that I used in my cluster analysis:
- Explosive Run Rate (Runs where RYOE > 10)
- Negative Run Rate (Runs where RYOE < -5)
- Yards after Contact per Attempt (YAC/Att)
- Yards per Route Run (Yards/RR)
- WR Snap Rate (Rate where RBs lined up as a WR on passing snaps)
- Broken Tackles per Attempt (# of broken tackles / rush attempts)
This was a little tricky to select because unlike receivers, there aren’t a ton of stats that can be used to differentiate RBs. I felt these stats would be able to help to find RBs that were the most alike. Additionally, none of these variables are too alike which would cause the analysis to be skewed. Using these variables, I created 5 clusters for NFL RBs.
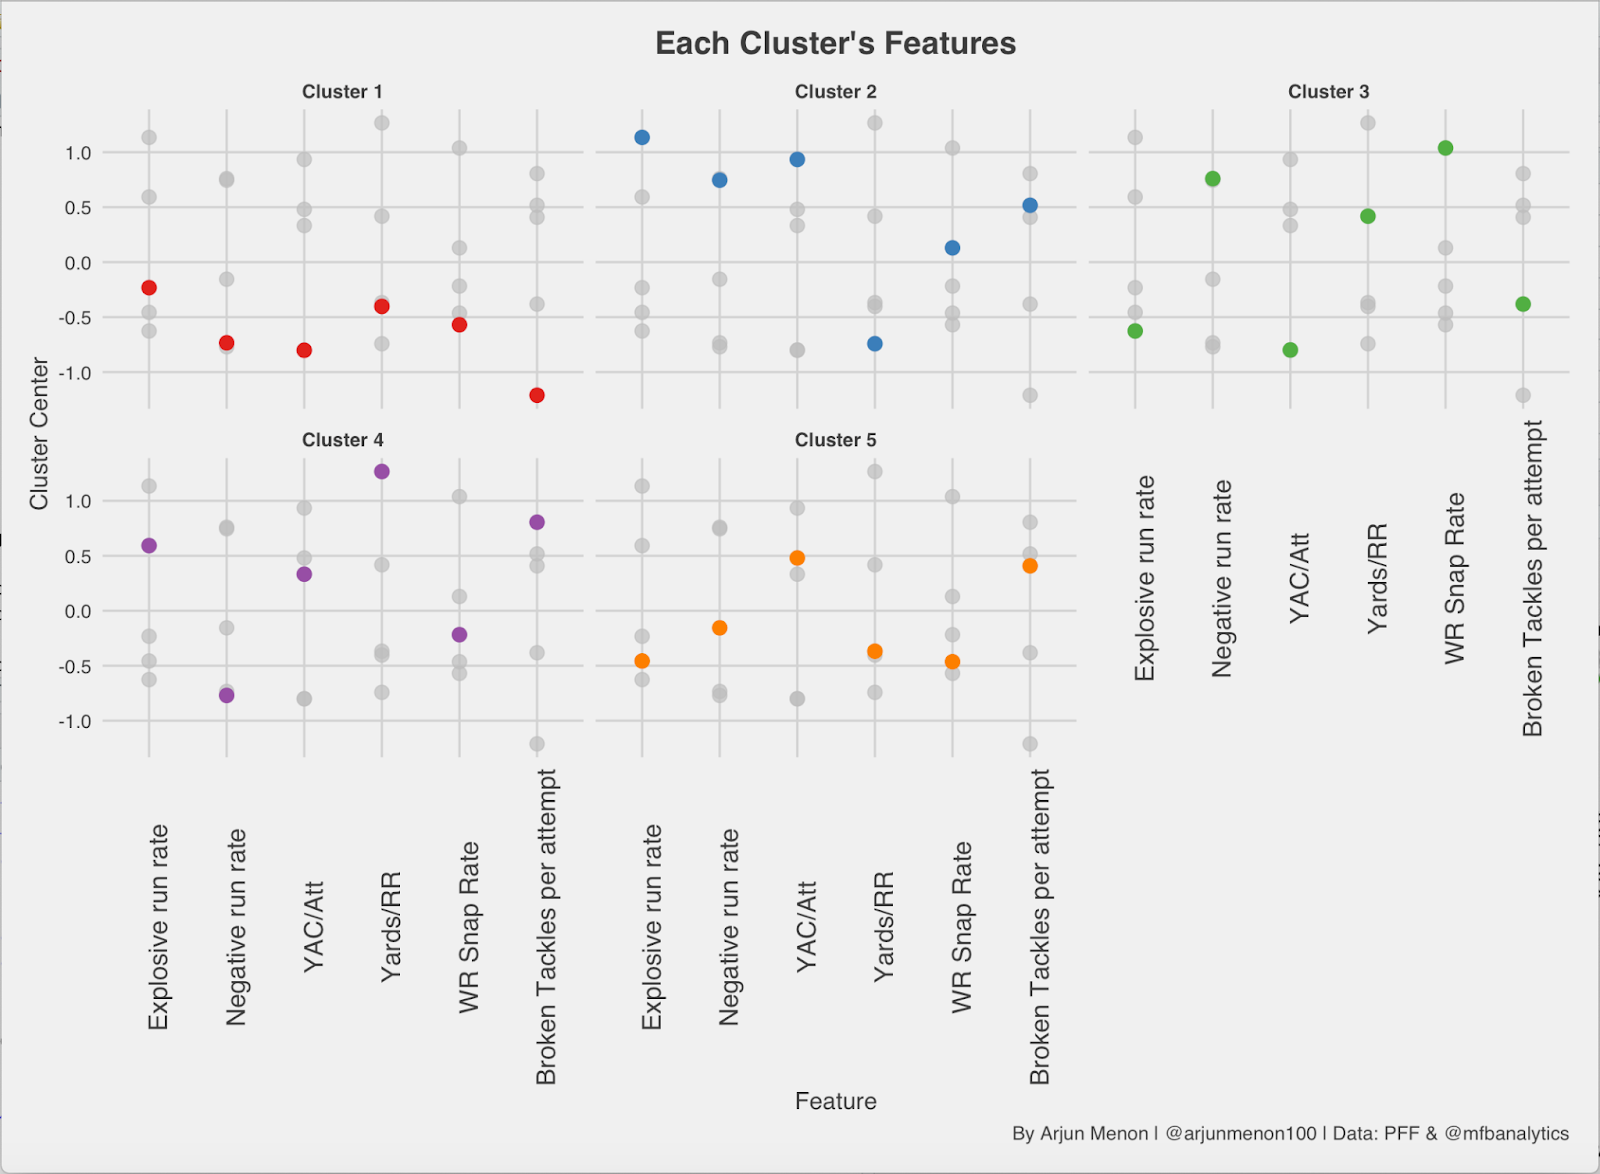
Here is the breakdown of the clusters:
- Cluster 1: “Shouldn’t be Getting Carries”
- Low Broken Tackles per Attempt
- Low Yards after Contact per Attempt
- Low WR Snap Rate
- Cluster 2: “Big Play Ability”
- High Explosive Run Rate
- High Negative Run Rate
- High Yards After Contact per Attempt
- Cluster 3: “Only Use Them on Third Down”
- High Negative Run Rate
- High WR Snap Rate
- Low Explosive Run Rate
- Cluster 4: “Mr. Reliable”
- Low Negative Run Rate
- High Yards per Route Run
- High Broken Tackles per Attempt
- Cluster 5: “Low Efficiency Power Backs”
- High Yards After Contact per Attempt
- High Broken Tackles per Attempt
- Low Explosive Run Rate
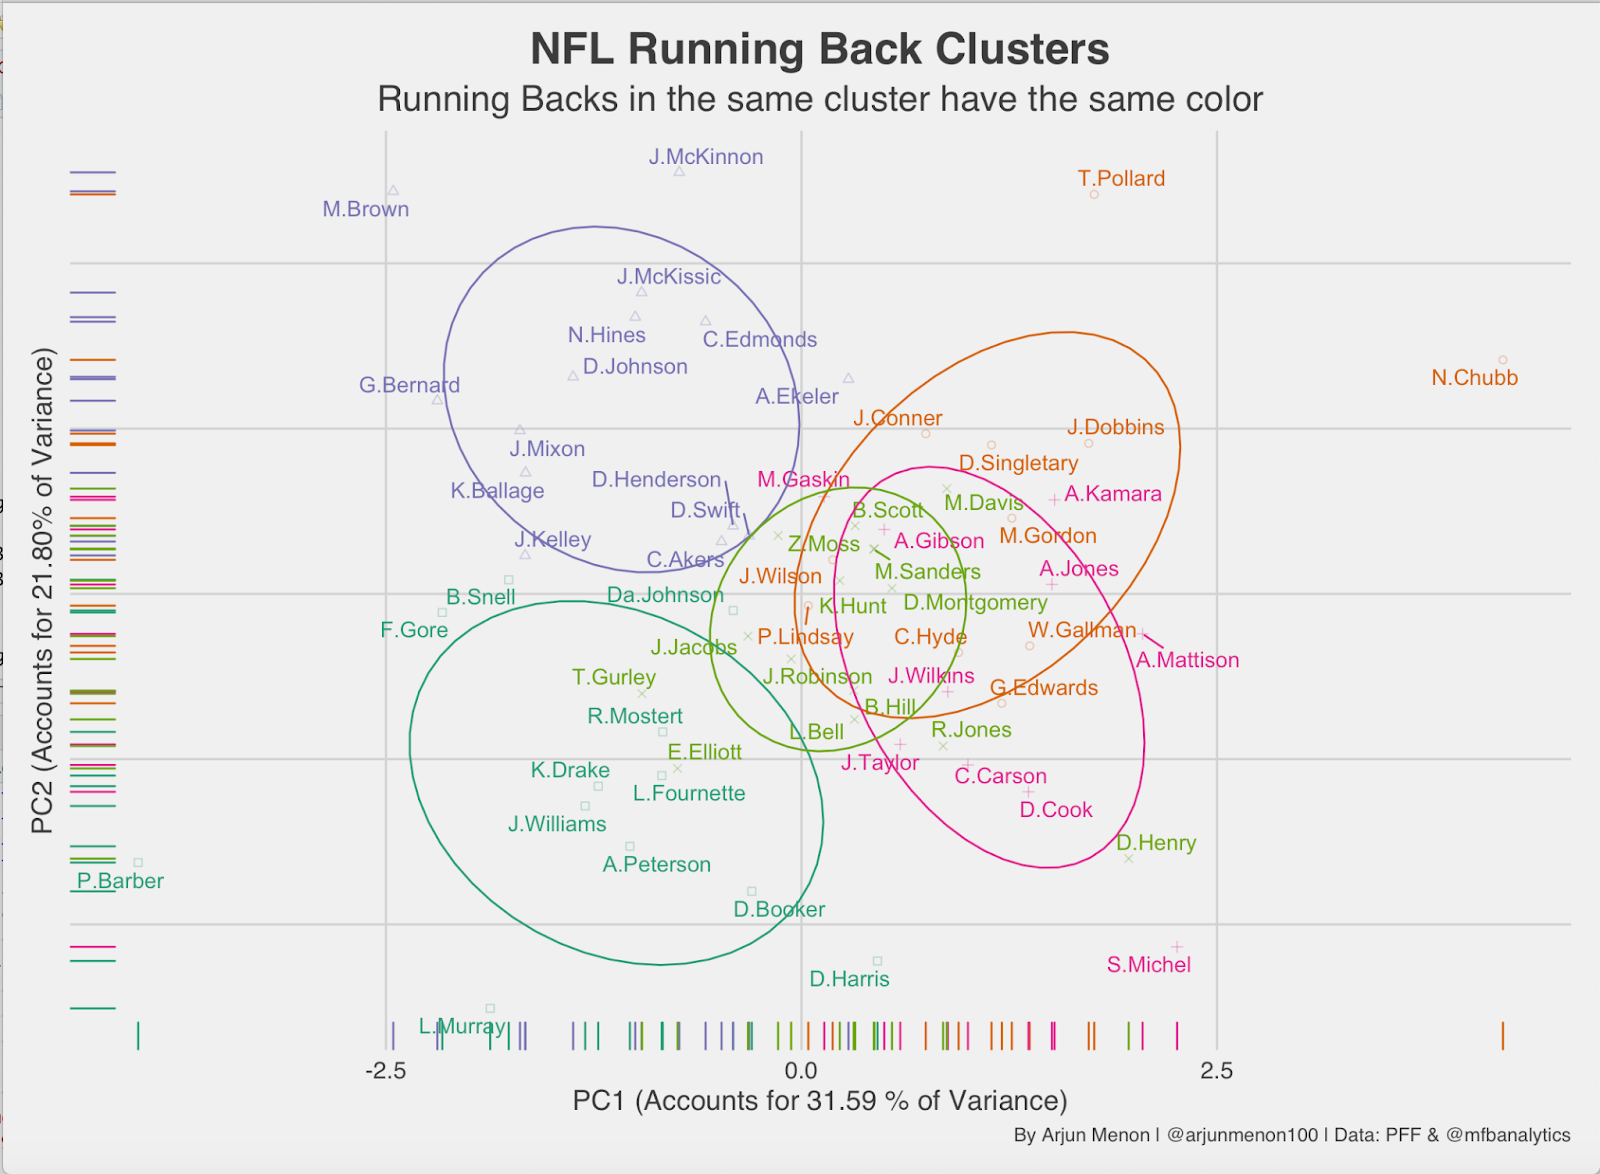
This is a PCA cluster analysis of every running back and the cluster they’re in. There are a couple names missing due to spacing issues, but this contains the running backs that had over 80 attempts per PFF.
Nick Chubb is a clear outlier from his cluster because he is one of the best RBs in the league, and is a just an outlier in general. Peyton Barber on the other hand might have been one of the worst RBs in the league based on his position in the PCA analysis.
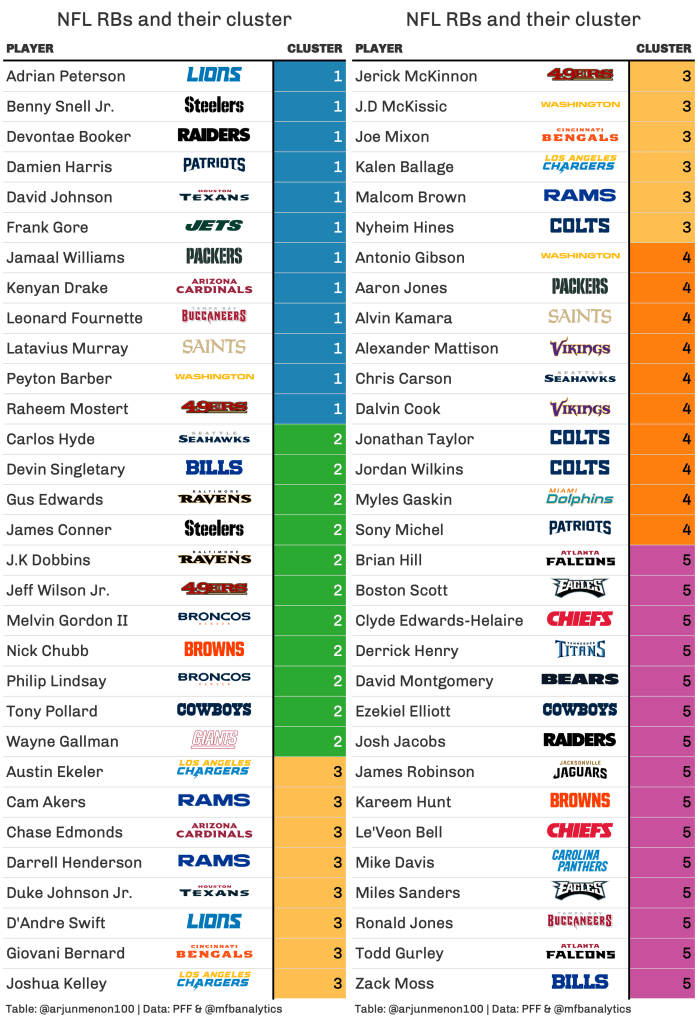
Just like the last article, I made a table to supplement the graph, as well as allowing you guys to see every player in Clusters 1-5.
Now let’s analyze each cluster and see if the players inside make sense:
- Cluster 1: It’s good seeing that Cluster 1 contained names like Adrian Peterson, Frank Gore, and David Johnson as they were all highly inefficient last year for their respective teams. None of the RBs in this cluster are big receiving threats either which makes sense given that a low WR snap rate is a feature of this cluster.
- Cluster 2: It is fair to say that this cluster contains guys who can break a run for 30+ yards or get stuffed behind the line of scrimmage. There are uber efficient RBs like Nick Chubb and Gus Edwards, as well as less efficient RBs like Melvin Gordon II and James Conner.
- Cluster 3: This group was labeled as the third down only group because they’re all great as receivers, but terrible as RBs. Players like Chase Edmunds, Gio Bernard, J.D McKissic, and Nyheim Hines are all players that fit this bill. This cluster also is made of RBs that are wildly inefficient on the ground which are exemplified by guys like Joshua Kelley, Jerick McKinnon, and Kalen Ballage. Pretty crazy that the Chargers have 3 RBs in this cluster alone.
- Cluster 4: It’s good that some of the best RBs in the league are in this cluster including Alvin Kamara, Dalvin Cook, and Aaron Jones. However, there is a case to be made that the low negative run rate can be attributed more to these RBs having stellar offensive lines. The Packers, Saints, Colts, and Patriots being in this cluster insinuate the idea. On the other hand, having a high yards per route run also means these RBs are all-around players, which does make sense given the quality of players in this cluster.
- Cluster 5: This cluster contains the “power backs” in the NFL and do very well after contact. This is confirmed after seeing players like Derrick Henry, Josh Jacobs, and Kareem Hunt. None of the players in this cluster are big play guys which resembles the low explosive run rate which is a feature of this cluster. These RBs will likely break your defense down with their physical running style.
Unlike the WR clusters, the range of distribution seems to be a bit more evenly distributed across all 5 clusters in this model. Is this idea portrayed when only looking at the RB1 for every team?
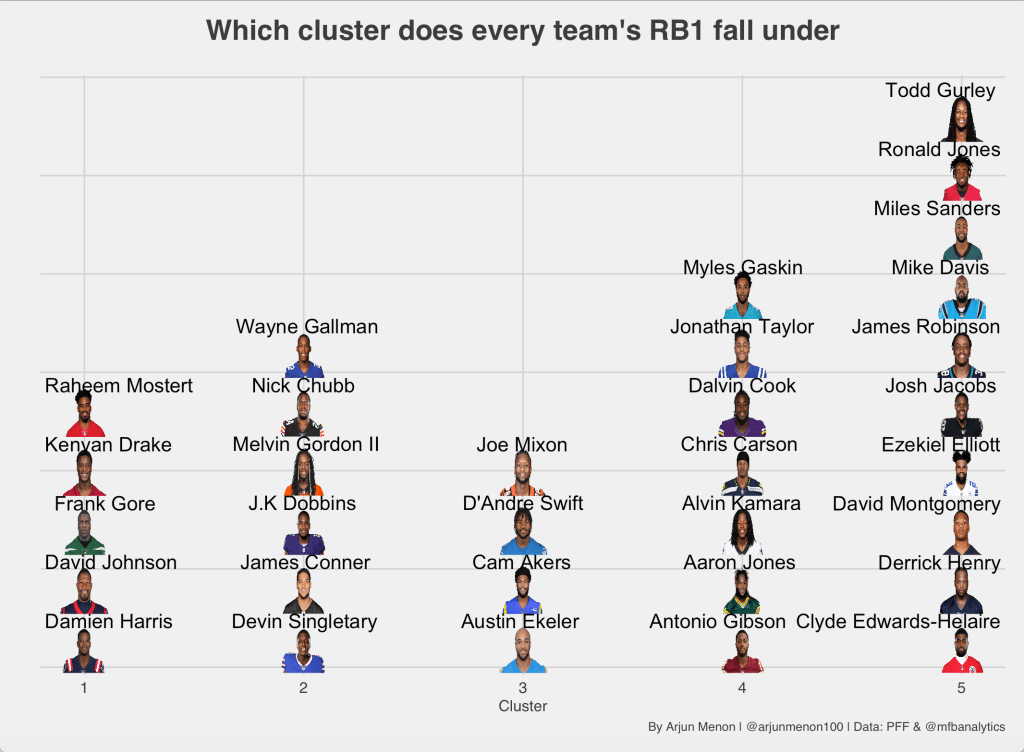
Upon review, the range of distribution seems to be a bit skewed towards Clusters 4 & 5. 17/32 teams have their RB1 in these 2 clusters. I would be interested to see where injured RBs like Christian McCaffery and Saquon Barkley fall under had they played in 2020.
Another question I asked myself is: Are there clusters where you want your team’s RB to be in? Like I mentioned earlier, it’s very tough to evaluate RBs given that most of their production is dictated by their offensive line + how many box defenders there are. However, we are lucky that there is a public RYOE model made by Tej Seth which can tell us the best RBs from any year dating back to 1999. Using his RYOE model, I was able to find the mean RYOE for every cluster:
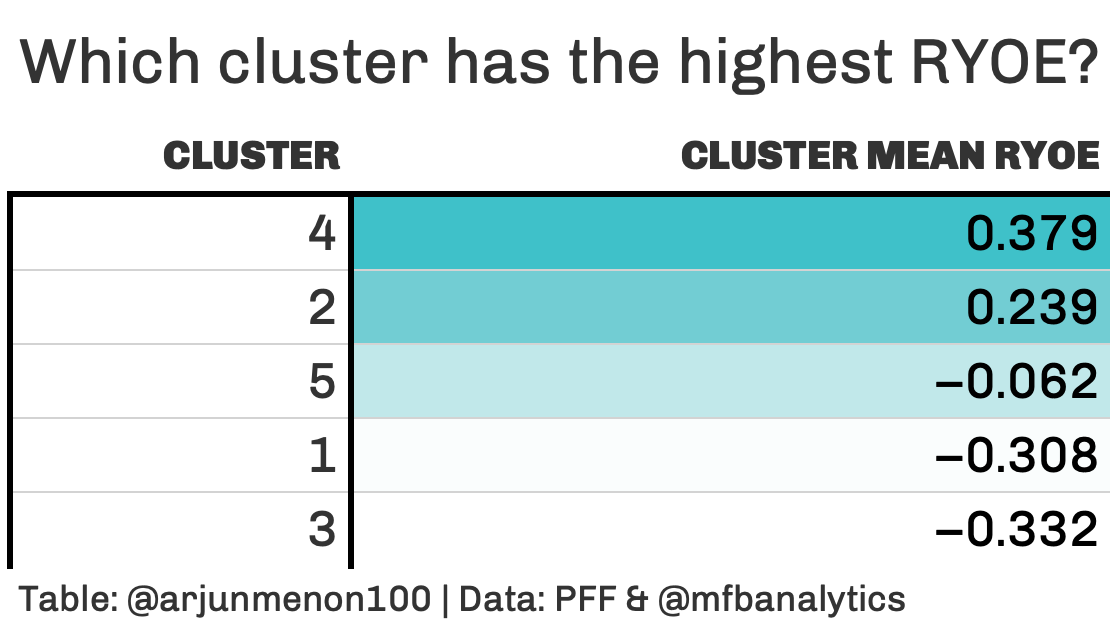
If there’s a cluster you want your RB to be in, it’s Cluster 4. On the flip side, if you have a running back in cluster 3, he probably should be replaced. The difference between the mean RYOE from Cluster 4 to Cluster 3 is around 0.6 yards per attempt, which is pretty significant.
That will bring us to the end of this article. I hope you guys were able to see which RBs were the most similar in 2020, and enjoyed the visualizations I put together. As always, I want to thank Alex Stern for his tutorial, Tej Seth for his excellent RYOE model and for making it open for the public to view, and PFF for the data which I used to make the model.
Make sure to follow us on Twitter @mfbanalytics and myself @arjunmenon100
