Owen Yoo, Ben Weber, Eliana Detata
Abstract
Given the access to valuable play-by-play data through the 2024 Big Data Bowl, we decided to investigate the force generated by tackles. We hypothesized that the force of the tackle is meaningful in tackling success and sought to quantify it accurately. By modeling this metric, which we will refer to as “force generated at the spot of the tackle” against an array of potentially significant variables, we wanted to create an expected force metric that could be compared to the actual force generated on a specific play. From experimentation and analysis, we hoped to generate actionable insights and inspire further research into the relationship between force and tackling in the NFL.

Methodology
What is force generated at the spot of the tackle?
It is the total force entering a collision between the tackler and the ball carrier. For example, if a safety comes bearing down with high acceleration on a receiver running a dig route across the middle of the field, the tackle would result in a very high force generated. On the contrary, if an outside linebacker manages to trip up a running back as he tries to get the edge, the tackle would result in a very low, negative value because force is exiting the spot of the tackle. To further explain, this occurs because the force component of the running back is larger and points in the opposite direction of the tacklers.
Equipped with millions of data points across several tables, we sought to achieve the objectives of our research by first synthesizing the data. This involved using similar primary keys to merge information together from the player, plays, and tracking data sets. We further reduced the scale of the data by focusing only on observations where a tackle attempt occurred or the ball carrier received the ball, with the belief these instances were the most critical to the investigation.
There were a few important quantities to take into account when creating the force generated column:
- Extracting the exact moment of the tackle in the play-by-play data
- Mass of both the ball carrier and tackler
- Acceleration of the ball carrier and tackler
- Correctly adding the force component of the ball carrier to the tackler’s
Considering the force of both the tackler and the ball carrier in terms of force components allowed us to accurately capture the amount of force being generated at the spot of the tackle. Simply adding the force of the tackler and ball carrier at this moment will not yield a true representation of the tackle. Plays like the one discussed at the beginning of this section could indicate an extremely high amount of force was generated, when in reality there is more force leaving the spot than entering. With an understanding of which absolute differences in angular direction would require certain trigonometric functions, we calculated and added the force component of the ball carrier to the raw force of the tackler.
After successfully quantifying the force generated, we began to consider what variables might be influential in predicting the force generated on any given play. Both variables we had access to in the data set and variables we derived were included in our model. In order to provide more extensive clarity on the variables that were included in the model, we will go into detail here. For a recap of all significant variables, (most obviously mass and acceleration) visit the terminology section.
New Metrics
As should be expected, the difference in angular direction between the tackler and ball carrier at the moment of the tackle (denoted by differenceAngularDirection) was the most important of these variables, as it directly relates to the force component added. Values close to zero indicate the direction of the ball carrier’s movement is pointing away from the spot of the tackle, while values close to 180 indicate the opposite.
Difference in the tackler’s orientation and angular direction at the moment of the tackle (denoted by DIOVDT_T) quantifies how well a tackler “squared up” his movement during the tackle. This means how similar the direction of the tackler’s movement is compared to the direction he faces. We investigated this variable because we anticipated a correlation with the force generated. For example, tackles attempted with a big angular difference may indicate the tackle was made more reactively to the ball carrier’s movement. Values close to zero show the tackler squared up well while increasingly higher values show the opposite.
The tackle angle (denoted by tackleAngle) quantifies where the ball carrier was tackled relative to the direction he faced. If the ball carrier was tackled from behind, the tackle angle would be close to zero, while 180 if he was tackled from the front. The metric does not consider which side the ball carrier was hit, as being tackled directly from either side would result in a 90-degree tackle angle.
Distance between the players at the time the ball was received (denoted by distFromEachOther) reveals how far the tackler and ball carrier were from each other in yards. We found the distance using the given coordinates of each player and finding the hypotenuse between them.
Although the tackler’s acceleration at the moment of the tackle is far more predictive of force, we also thought it would be interesting to investigate his acceleration when the ball was received. Denoted by TacklerAcc_BR, tacklers who are already increasing acceleration at their point in the play are also more likely to enter the tackle with higher acceleration.
Lastly, the difference in the angular direction between the ball carrier and tackle at the moment of the ball received shows whether the tackler was moving towards or away from the ball carrier’s movement. Tacklers moving in the direction of the ball carrier at this point are generating acceleration in the right direction and are also more likely to make a proactive tackle. Values near zero communicate the tackler was moving away from the ball carrier while values near 180 reveal the opposite.
Results
Once we derived and included the metrics we considered important, we used a linear regression model to create our expected force generated metric. Then, we displayed the prediction of the model against the actual force on each play on a scatter plot. The results are shown below:
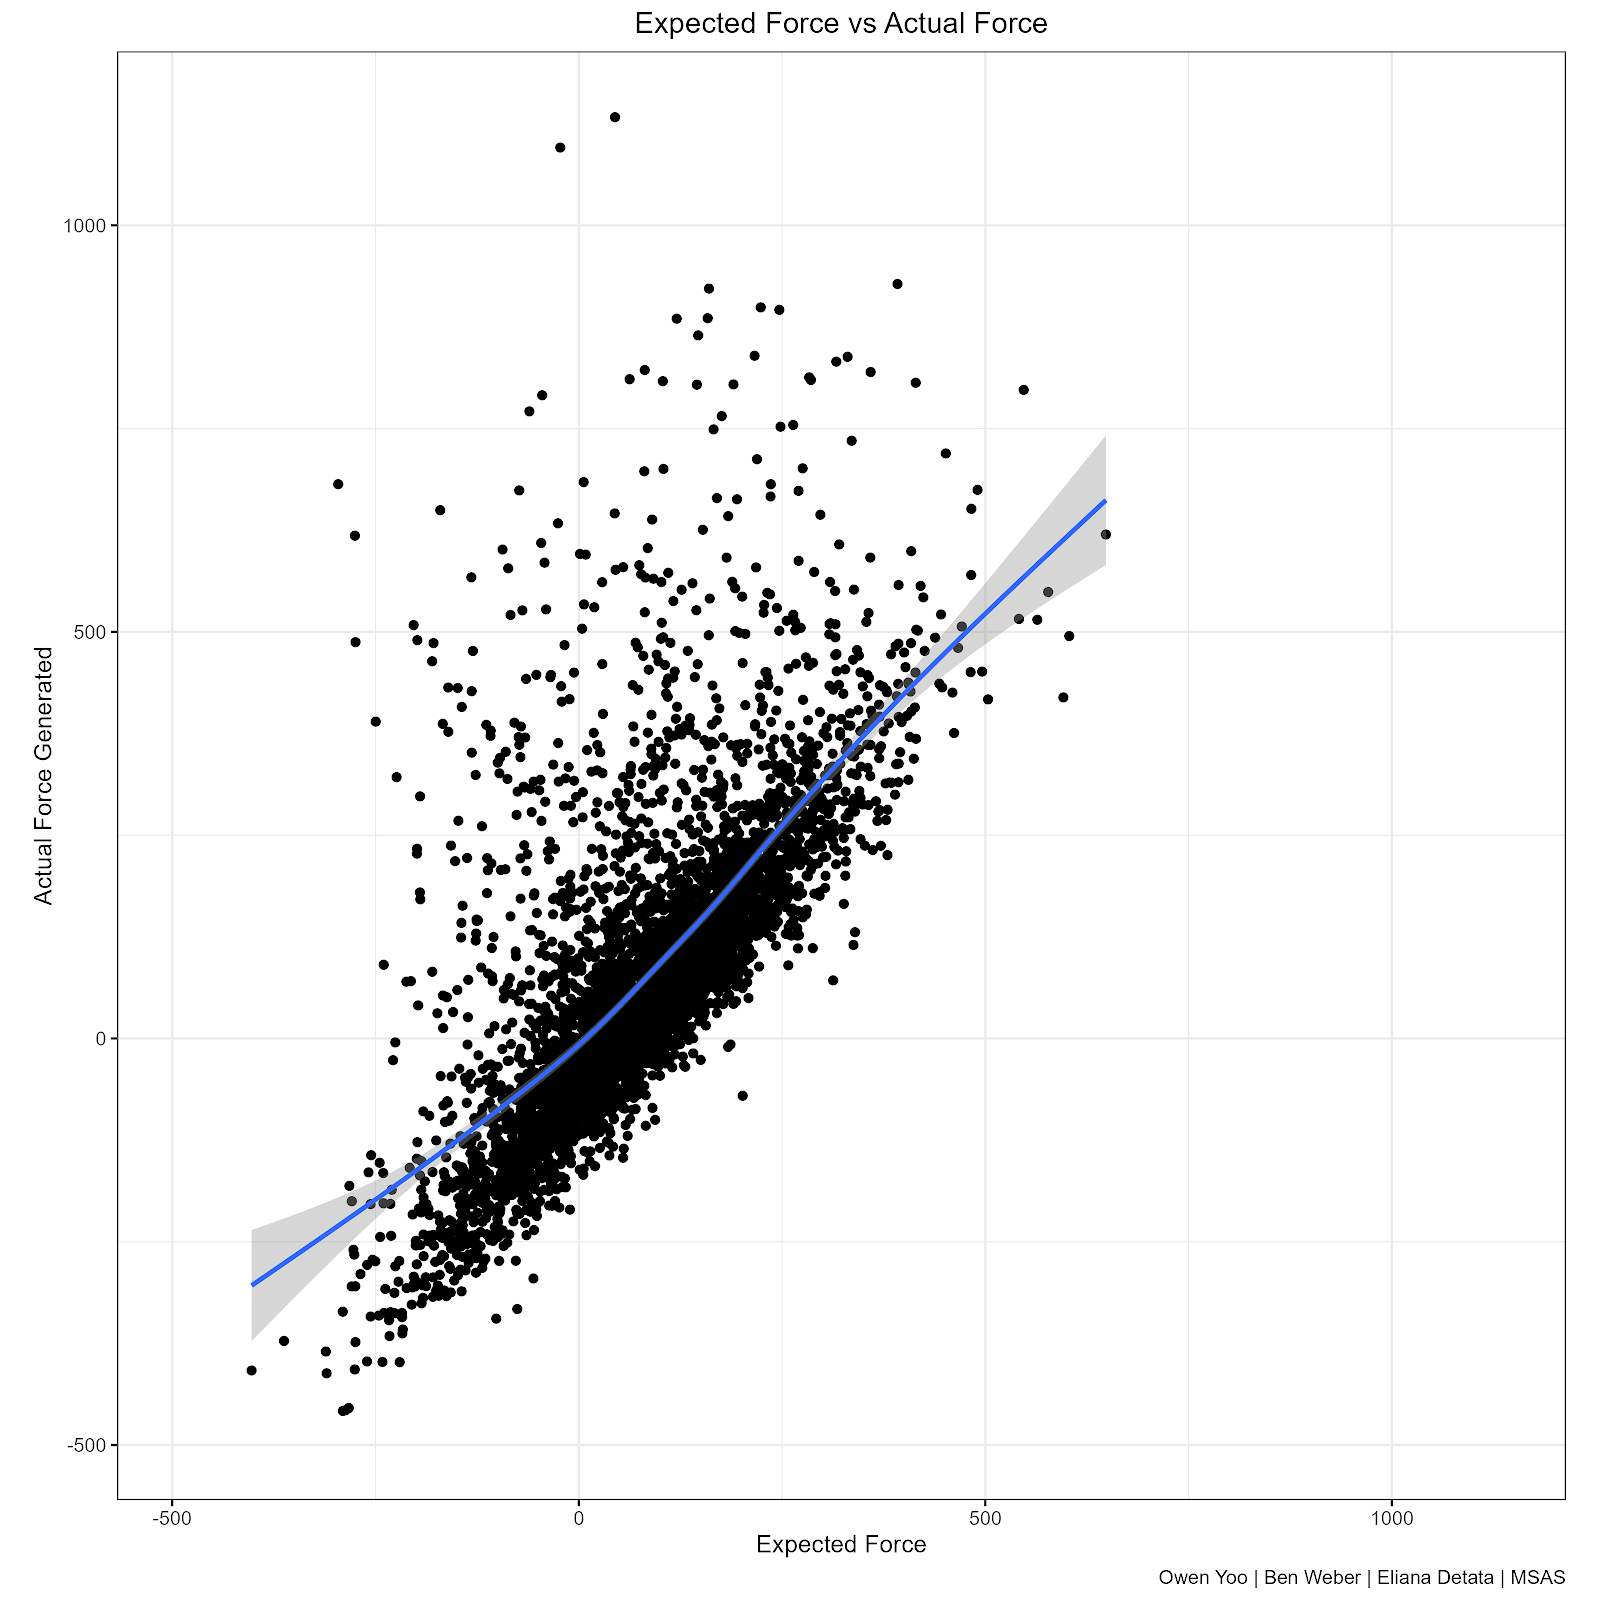

The expected force is generally predictive of the actual force on a given play, but the strength of the correlation between the two (r-squared of .4915) is greatly weakened by many outliers. All of the outliers follow the same pattern, in which the expected force predicts a value at near or below zero, but the tackle actually generates an extremely high value. At first glance, we concluded some important factors were still being overlooked and that a deeper investigation into these specific plays could reveal new insights. However, after looking closer at the individual weights of each variable in the model, we found that a few variables were influential, but in the opposite direction we expected.
The most notable variables, and the ones likely causing the outliers are the ball carrier’s mass and acceleration. Both variables have a negative correlation with expected force, revealing the greater the mass and acceleration of the running back, the lower the model predicts the force generated at the spot of the tackle. How can this be? It relates back to the discussion of force components, in which the direction of the ball carrier’s movement relative to that of the tackler is critical in whether the force component adds or subtracts force to the spot of the tackle. When running backs reach a high acceleration, they move away from the direction of the tackle at a proportion large enough that the association is negative. Occasionally, the ball carrier does move almost directly towards the tackle with high acceleration and a huge amount of force is generated, which is not consistent with what the model predicts and hence why there are many outliers where actual force is so much higher.
Additionally, the difference between the orientation and angular direction of the tackler had a negative correlation. Contrary to what we predicted, greater differences were associated with a higher expected force. The reason for this could be that tacklers square up their momentum more frequently when tackling from behind because there is no question about the direction the ball carrier will go. It would be worth investigating if the relationship changes if observations where the tackle was attempted from behind were removed.
These are a few considerations to keep in mind to improve the model’s capability and our understanding of the factors that contribute to force generated at the spot of the tackle.
Analysis
Using the results of our model, we subtracted the actual force generated by the expected force generated on each play to analyze the data in terms of force over expected. Note that after cleaning the original datasets we obtained nearly 5,000 solo tackles from weeks one through nine of the 2022 NFL season. We filtered out plays in which the ball carrier directly took the snap (mainly QB rushes) and plays where the ball carrier simply ran out of bounds. We decided to remove the outliers from this analysis because we know they occurred due to a shortcoming of the model. Even after the reduction, there were still over 4,600 plays factoring into our analysis.
Our analysis comes in the form of player evaluation, positional evaluation, and locational evaluation tools. We choose these areas because we believe they could be impactful in improving the knowledge, strategy, and technique of tackling. The player evaluation tool looks at force over expected for each player across their regular tackles in a density plot:


The lines highlighted in red represent the top five tacklers in terms of their average force over expected, while the blue lines display the top five tacklers in terms of the total tackles they attempted. Players with more area under the curve to the right of the graph are averaging higher force over expected. Players that have tall and narrow distributions tackle fairly consistently in that range of force over expected. This tool gives coaches a normalized metric of which players tackle the hardest and which players could use improvement in their tackling approach. It gives players tangible evidence of the quality of their tackling approach which could potentially be leveraged in contract negotiations.
The positional evaluation tool looks at tackling performance by position:

Each bar illustrates a position’s average force over expected. From the graph, defensive backs are the most likely to underperform in this metric, averaging about -60 force over expected. It is interesting to note that strong safeties perform better than the rest of the defensive backs, which aligns with the notion that they are typically more effective tacklers. Furthermore, each level of the defense performs worse than the last. Two likely reasons for this are the hesitance of smaller defensive backs when they attempt tackles and the idea that it gets progressively more difficult to tackle in space than in the trenches.
The locational evaluation tool tracks force over expected by location on the field:

This visualization is a 2D density plot overlaid on the football field. Darker shades of red denote worse performances by tacklers in terms of force generated over expected. The shadings of both end zones should be ignored because they only include a few yards and there are not large enough samples of tackles to make any meaningful insights. Overall, there appears to be a trend of weaker force along the sideline and the red zone. Along the sidelines, defenders face greater unpredictability because these tackle attempts are likely to be reactive to the ball carrier. Defensive backs, who perform the worst in this metric are also required to make these tackles the most frequently. As for the red zone, players must navigate traffic, making it hard to generate the same amount of force as they could in a regular part of the field. Improving the force generated by players in these locations could be reflected in an improvement in tackling performance along the sideline and in the red zone.
Limitations and Areas for Improvement
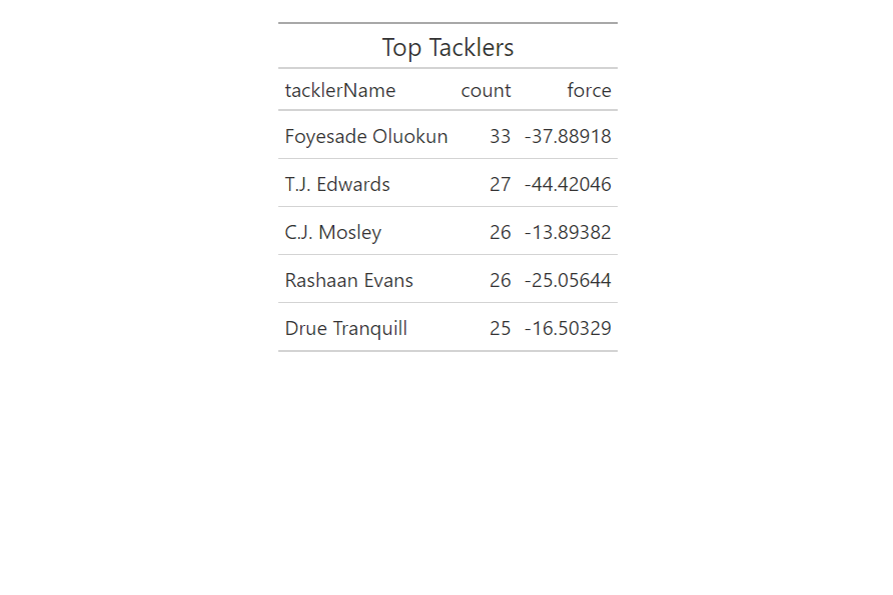
Although we have discussed these areas throughout the article, there are a few aspects of this study we believe can be improved. Primarily, access to more tackling data would further optimize the model and evaluation tools, especially for the players. Since we only obtained nine weeks of tackling data, the most total solo tackles any one player recorded is 33. As a result, many prominent defenders barely have ten tackles. Therefore, there will be more variance in the average force over expected. More observations would increase confidence that the results accurately reflect a player’s performance.
The model is still relatively weak in its prediction because of the outliers. We want to determine a method or factor that helps the model better predict high-force-generating tackles. If this was accomplished, the evaluation tools would be more representative and reliable because they would include all the data.
Lastly, it is important to understand the force generated at the spot of the tackle is not the only influential factor in successful tackling. It does not consider the location of contact or leverage of the force – two variables that are likely more important to tackling.
Thanks for reading and please feel free to contact us regarding questions, comments, or suggestions on this project!
Terminology
Force Over Expected: (Actual force given – Expected force given)
A measure of a tackler’s performance by their produced force above expectation.
TacklerAcc_T: This variable represents the acceleration of the tackler at the moment of the tackle
BallCarrierAcc_T: This variable represents the acceleration of the ball carrier at the moment of the tackle
tacklerMass: This variable represents the mass of the tackler
ballCarrierMass: This variable represents the mass of the ball carrier
differenceAngularDirection: This variable represents the difference in the angular direction of the ball carrier and tackler’s acceleration at the moment of the tackle. Values close to 180 indicate that the players were moving towards each other, while values close to 0 indicate that the players were moving away from each other
DIOVDT_T: This variable represents the difference in a tackler’s orientation compared to the direction of his movement at the moment of the tackle. It reveals how well the tackler squared up his momentum going into the tackle
tackleAngle: This variable represents the angle from which the ball carrier was tackled from. Values close to 180 indicate the ball carrier was tackle from the front, while values close to 0 indicate the ball carrier was tackled from behind
distFromEachOther: This variable represents the distance (yds) between the ball carrier and the tackler at the moment of the handoff/completion.
TacklerAcc_BR: This variable represents the tackler’s acceleration at the moment the ball was received. (handoff or completion) It allows us to consider the influence of the tackler acceleration at this critical moment of the play
ballReceivedAngle: This variable represents the difference in the angular direction of the ball carrier and tackler’s acceleration at the moment of the handoff/completion. Values close to 180 indicate that the players were moving towards each other, while values close to zero indicate that the players were moving away from each other
distFromFirstDown: How far, in yards the tackle occurred from the first down line
playResult: The number of yards gained on the play
passProbability: The likelihood of the play being a pass pre-snap
ballCarrierAcc_BR: The acceleration of the ball carrier at the moment he received the ball
tackleDistFromCenter: How far, in yards the tackle was made from the center of the field
