Watching the Chiefs, Bills and Packers all make their conference championships, a thought popped into my mind: The way these teams run their offense is very similar to one another. From an X’s and O’s perspective there are many differences but from a data perspective the Chiefs, Bills and Packers all had similarities. They pass a lot on early-downs (easier to do so when having an elite quarterback), their quarterbacks almost never take sacks but don’t scramble as much as average and they have a high yards after catch thanks to their scheme getting the ball to Tyreek Hill, Stefon Diggs and Davante Adams in creative ways.
I wanted to figure out a way to see if the data back this up. That’s when I stumbled upon this tremendous tutorial by Alex Stern on clustering NBA players. Clustering is taking in a set of variables and plugging it into a model to try to match similar teams together. Following his tutorial, I was able to apply the same principles to each NFL offense. I even provided my own code at the end of the article in case anyone wants to emulate this! Using variables provided by nflfastR, this is what I put into my cluster analysis:
- Pass Rate Over Expected (PROE)
- Outside Run Rate (ORR)
- Inside Run Rate (IRR)
- Yards Per Attempt (YPA)
- Yards After Catch (YAC)
- QB Scramble Rate (QBSR)
- QB Sack Rate (SaR)
- QB Hit Rate (QBHR)
- First Down Pass Rate (FDPR)
- Yards Pass the Stick (YPS)
By using these variables, I was able to get a good feel on how pass-heavy a team is, where they like to run the ball, if they rely more on air yards or yards after the catch and how their quarterback acts in the pocket. Even though some of those are production based like scramble rate, I had to include them to get a good feel of a team like the Ravens who wouldn’t be complete without that stat. This left us with 6 clusters of NFL teams:
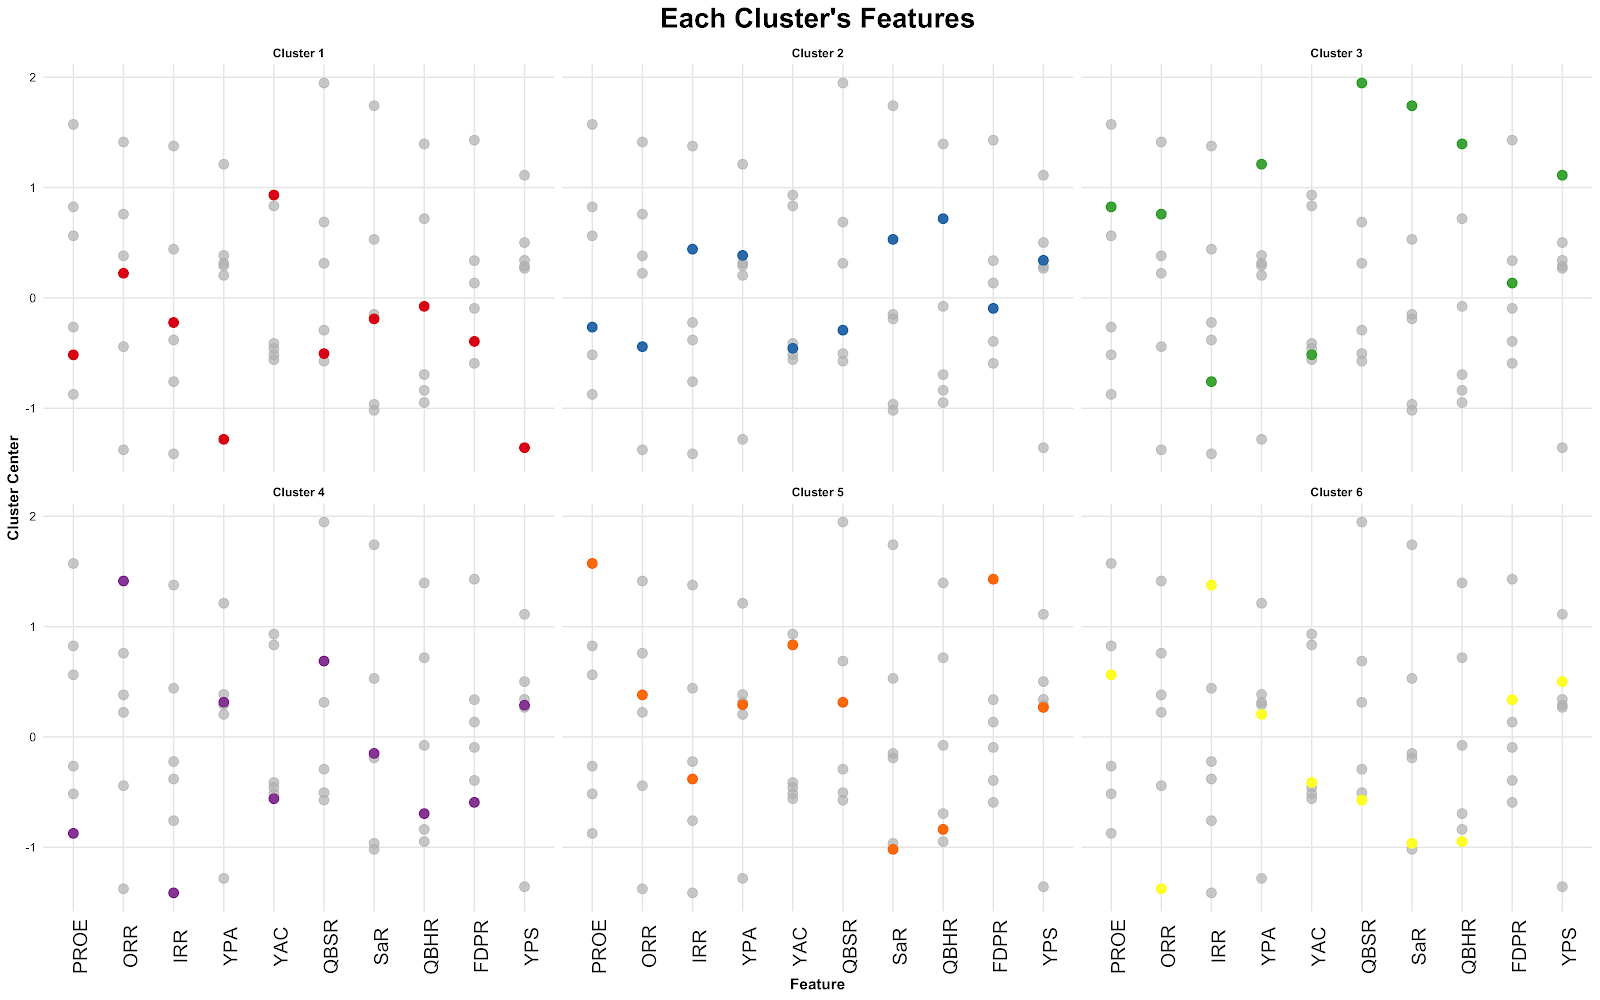
- Cluster 1: “Offensive Geniuses”
- Low Pass Rate Over Expected
- High Yards After the Catch
- Low Yards Past the Sticks
- Example Team: Los Angeles Rams
- Cluster 2: “Quarterback Injuries”
- High Inside Run Rate
- High QB Hit Rate
- Example Team: Atlanta Falcons
- Cluster 3: “Please Save Us QB”
- High Yards Per Attempt
- High QB Sack and Scramble Rates
- High First Down Pass Rate
- Example Team: Seattle Seahawks
- Cluster 4: “Establish the Run”
- Low Pass Rate Over Expected
- High Outside Run Rate
- High QB Scramble Rate
- Example Team: Baltimore Ravens
- Cluster 5: “Super Bowl Contenders”
- High Pass Rate Over Expected
- High Yards After Catch
- Low Sack Rate
- Example Team: Kansas City Chiefs
- Cluster 6: “No Risk It, No Biscuit”
- High Inside Run Rate
- Low Yards Per Attempt
- Low Yards Past the Sticks
- Example Team: Las Vegas Raiders
And without further ado, here is each team fit into their cluster:
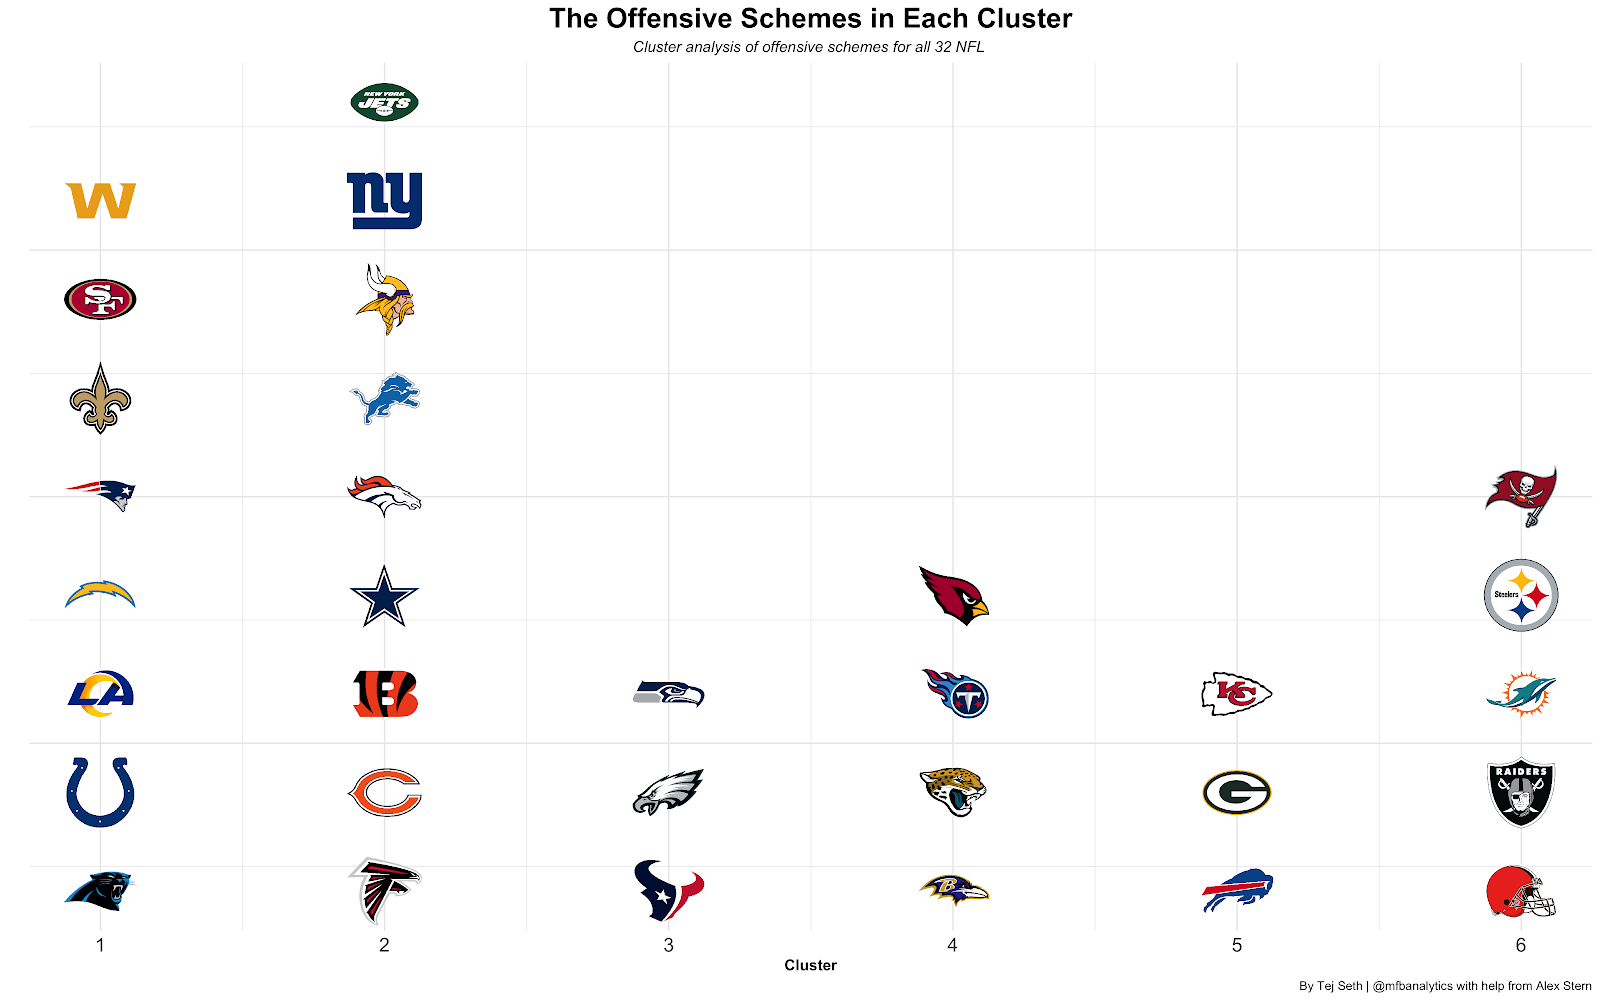
We can see if it matches up with what we thought. In cluster 1, the 49ers, Saints and Rams were limited with their QB sometimes but had a good enough scheme to generate YAC. In cluster 2, teams that didn’t have an identity either because of QB changes (Jets, Cowboys, Bengals, Bears) or had a QB that took too many hits (Falcons, Giants). In cluster 3, we have our offenses with high pass rates over expected but were limited because of weapons or scheme. In cluster 4, we have our heavy running teams with the Cardinals having an Air Raid Head Coach but surprisingly being -1% in Pass Rate Over Expected. The Jaguars are like the kid that has to move multiple times during high school so despite not really fitting in anywhere, they have to sit at a random lunch table and they picked cluster 4. In cluster 5, we have our aggressive pass-heavy kings. Finally, in cluster 6, we have our run-heavy teams (except the Steelers) with low yards per attempt.
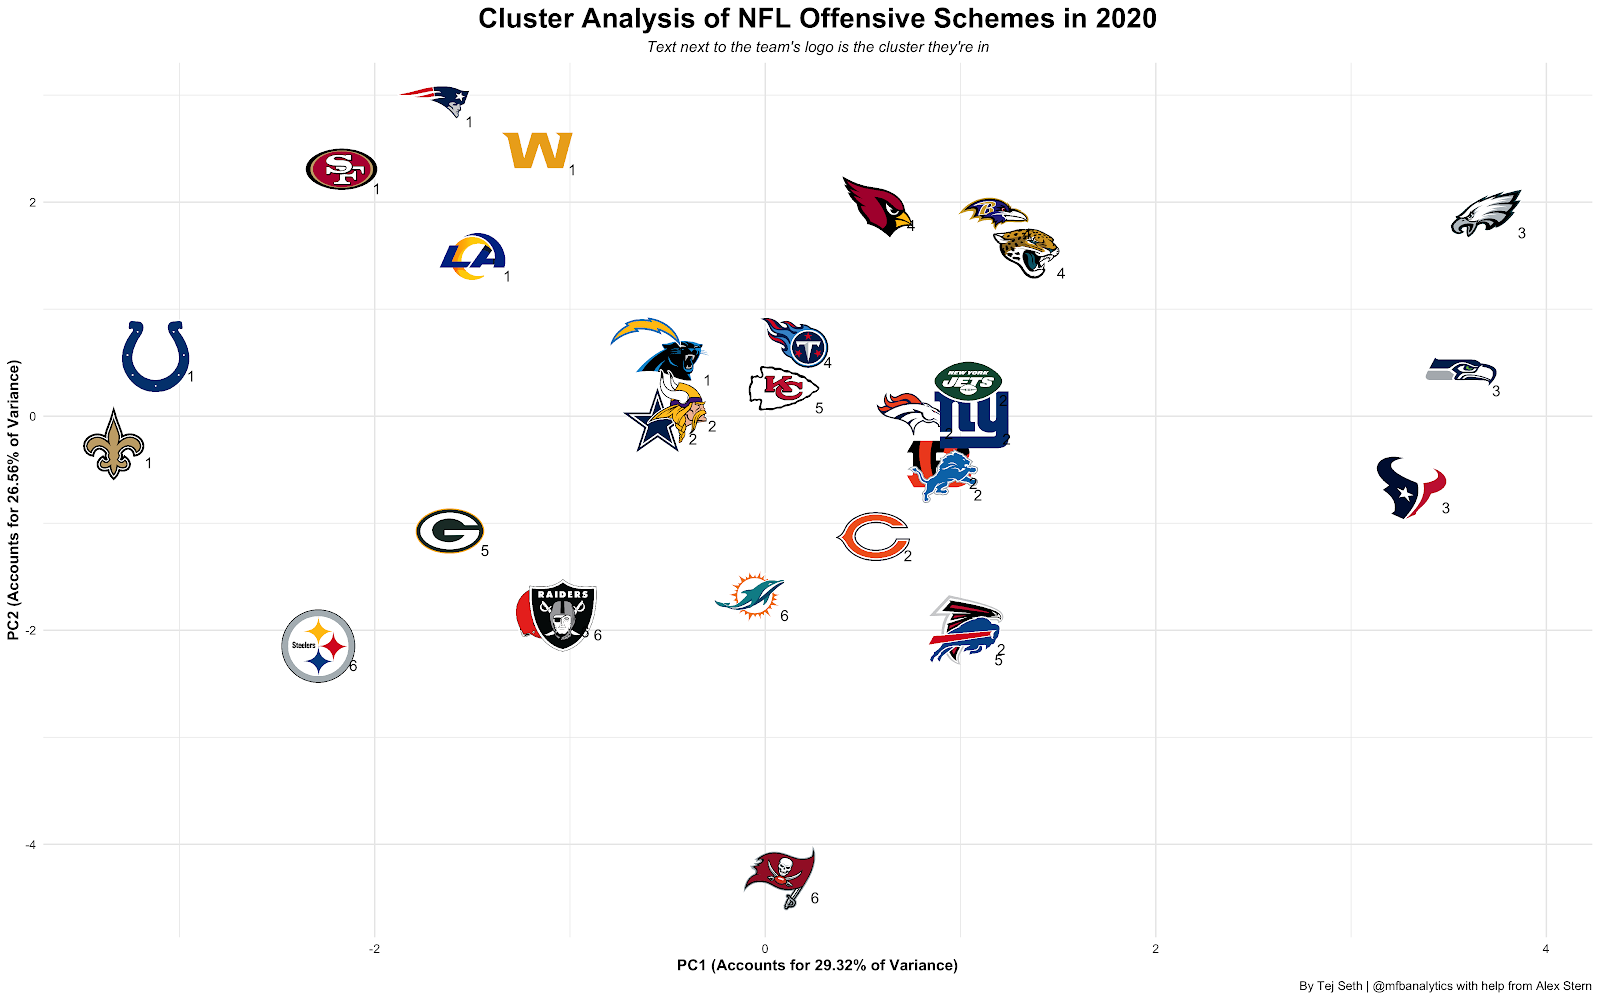
Taking is one step further, here’s a principal component analysis that graphs each team based on 2 defending principles with their cluster numbers attached to them on text:
Lastly, here is the average EPA/play of the group. The Cardinals, Ravens and Titans are really feeling what’s it’s like to work in a group project right now because that Jaguars are really bring them down:

That is all I have for today. I appreciate you reading through this whole article. Please follow me on Twitter @mfbanalytics and my DM’s are open for any suggestions!
My Code: https://github.com/tejseth/NFL-Clustering
Alex’s Amazing Tutorial: https://alexcstern.github.io/hoopDown.html
