
The scene is a high-end restaurant in New York City in the 1850’s. Chef George Crum had just made french fries and gotten them sent back as a picky customer claiming they were “too thick.” Out of spite, Crum sliced a paper-thin batch of french fries, fried them to a crisp and seasoned them with a lot of salt. The customer loved them. Crum had just accidentally made the first-ever potato chips.
Similar to Crum, I started out making a “Post-Game Forecasted Score Model” using advanced statistics from each NFL game. In a particular game, if a team did something that was unsustainable but their advanced metrics were low, their post-game forecasted score would be lower than their actual score. I found that in football, there are certain factors that can be attributed to luck and ones that could be attributed to skill. I was going to stop there as I thought that was good enough. But as I looked at it more-and-more, I realized that I also accidentally created a projection system that could try to predict the scores of NFL games before they happen. My accidental creation may or may not have the same influence on the world that potato chips do; only time will tell. Let’s dive in (and there will be betting advice at the end for those who stay)!
First off, I built the post-game forecasted score model using linear regression of over 2,500 past games and seeing which factors most strongly influenced the scores of games. Here are the factors ranked by influence (with their R^2 in parentheses):
- Expected Points Added (EPA) Per Play (0.76): Expected Points Added is an advanced metric that doesn’t treat all yards equally. For example, gaining 5 yards on 3rd & 2 is much more important than gaining 5 yards on 3rd & 19 and EPA takes that into account.
- Explosive Play Rate (0.60): The amount of plays an offense has in the top 15% of all NFL plays in regards to EPA.
- Series Success Rate (0.60): The rate offense scores a touchdown or field goal per drive during the game.
- Bad Play Rate (-0.51): The rate at which an offense has turnovers, penalties and big losses.
- Average Field Position (0.50): The average field position for an offense.
- Defensive Turnovers (0.12): Turnovers have some influence on the final score but less than the other advanced statistics. This is because turnovers only happen on about 2-5 plays a game so the sample size is really low while EPA involves all 60-80 plays an offense runs. Fumbles are 50% luck and interceptions are 33% luck according to Ed Feng, so they are unsustainable.
Using all of those factors, we can see the post-game forecasted points for week 13 of the 2020 NFL season:
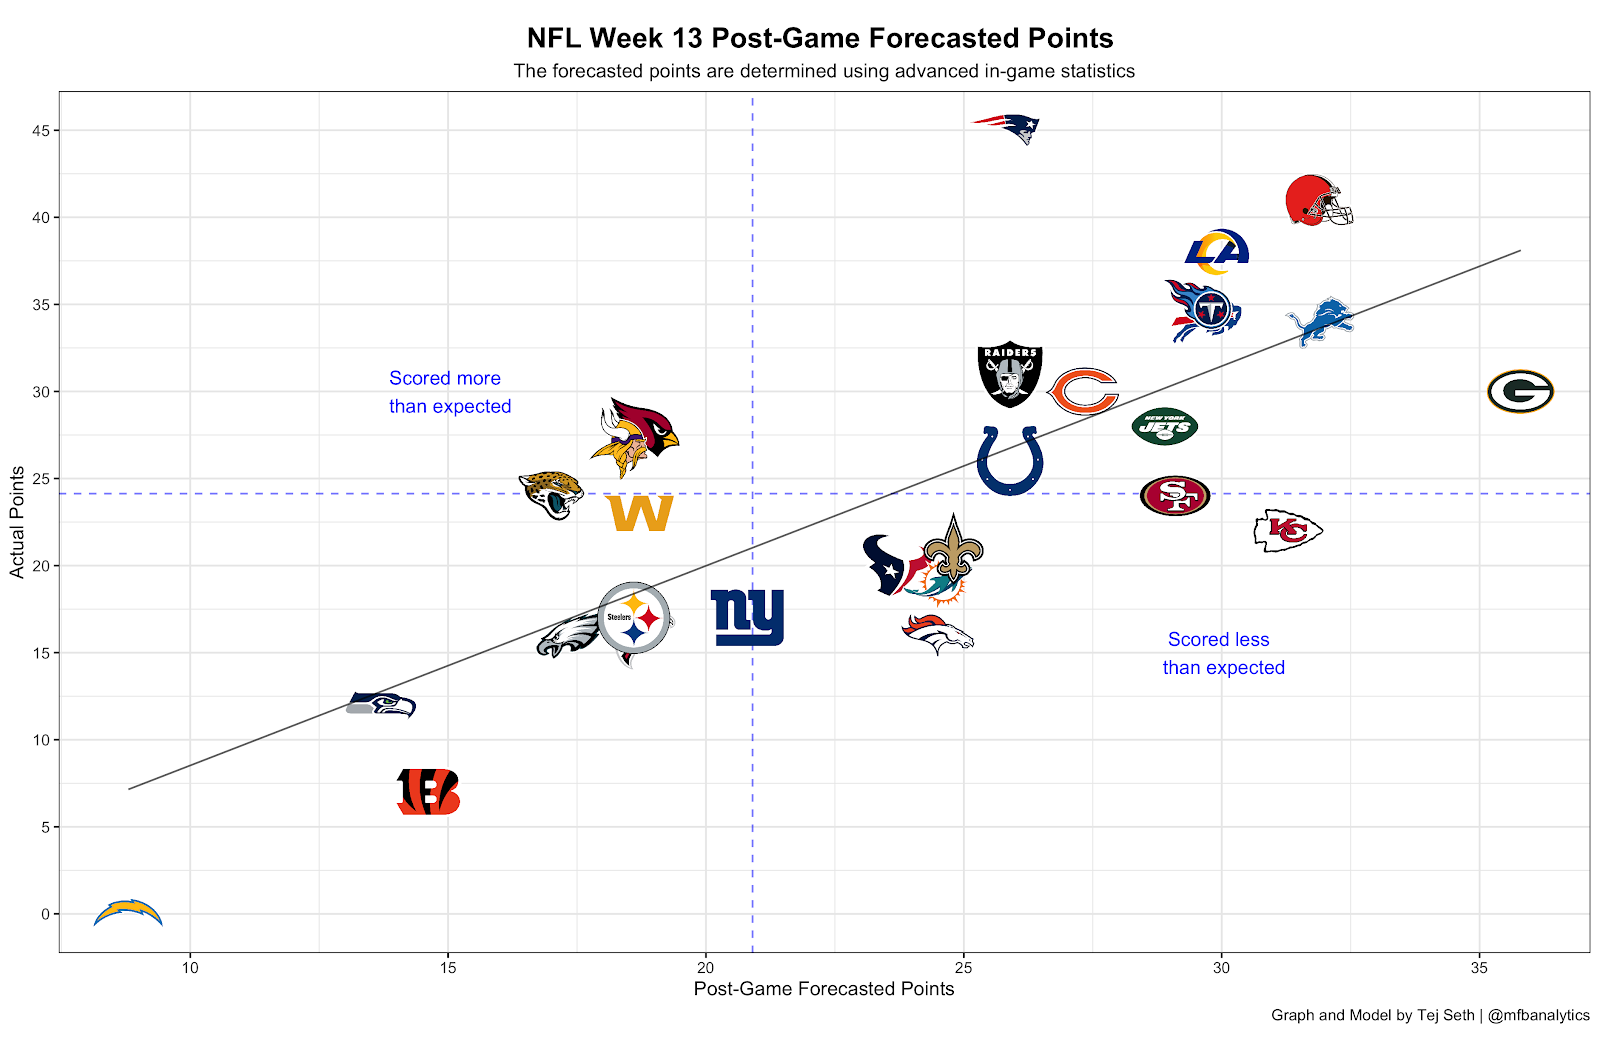
The Patriots have the biggest residual on this graph and for good reason. While the Patriots were forecasted to score 26 points because of a strong showing from their offense, they also had a punt return for a touchdown and blocked field goal returned for a touchdown which are things they can’t expect to happen every week. Because of that, their actual score was 45 points. The Chargers on the other hand, who have been cursed ever since Justin Herbert had his head shaved, were forecasted to score 8 points but ended up with 0. Looking at some other games, the Jets were forecasted to out-score the Raiders by 3 points but because of Gregg Williams’ defense I like to call “Tank Cover 0 Blitz,” the Raiders had essentially a miracle to win a game that they probably shouldn’t have won.
Using offensive forecasted points and defensive forecasted points, we can get a ranking system for every NFL team:

I believe this is better than just using average points because this takes out a lot of the fluff and focuses on statistics like EPA that will remain stable throughout the year and have been shown to be predictive. Through 13 weeks, the Chiefs, Packers and Steelers have emerged as the best teams in the NFL. The Saints with Taysom Hill (aka Mormon Manziel), Rams and Buccaneers are not far behind. On the other side, the Jets and the Cowboys have shown they are the NFL’s worst. Here’s where I realized I could start to project the scores of future NFL games.
Research has been done to show that a team’s offense has 2x the amount of influence over a team’s defense in any game. So using that we can come up with a formula:
A Team’s Projected Score = ((2*Avg_Off_Forecast + Avg_Def_Forecast) / 3)
And this is really fun to play around with for hypothetical matchups. If we get my dream Super Bowl of Patrick Mahomes with Russell Wilson we can project the score like this:
- Chiefs = ((2*32.3 + 27.1) / 3) = 30.6 points
- Seahawks = ((2*27.7 + 24.8) /3) = 26.8 points
A score of 31-27 seems fair for a Chiefs-Seahawks Super Bowl, especially one in which Russell Wilson is cooking. Or since it’s 2020 and crazier things have happened how about the Cleveland Browns vs. my Detroit Lions in the Super Bowl?
- Browns: 27.5
- Lions: 24.2
I wouldn’t like the result but I would just be happy to be there.
I started calculating some of these for the upcoming NFL games in week 14 and realized that I was getting scores that were very close to what the Las Vegas sports books were projecting for each game. So without further ado, here are all my projections for each NFL game and a little explanation on some of them to why I think the score is projected that way:
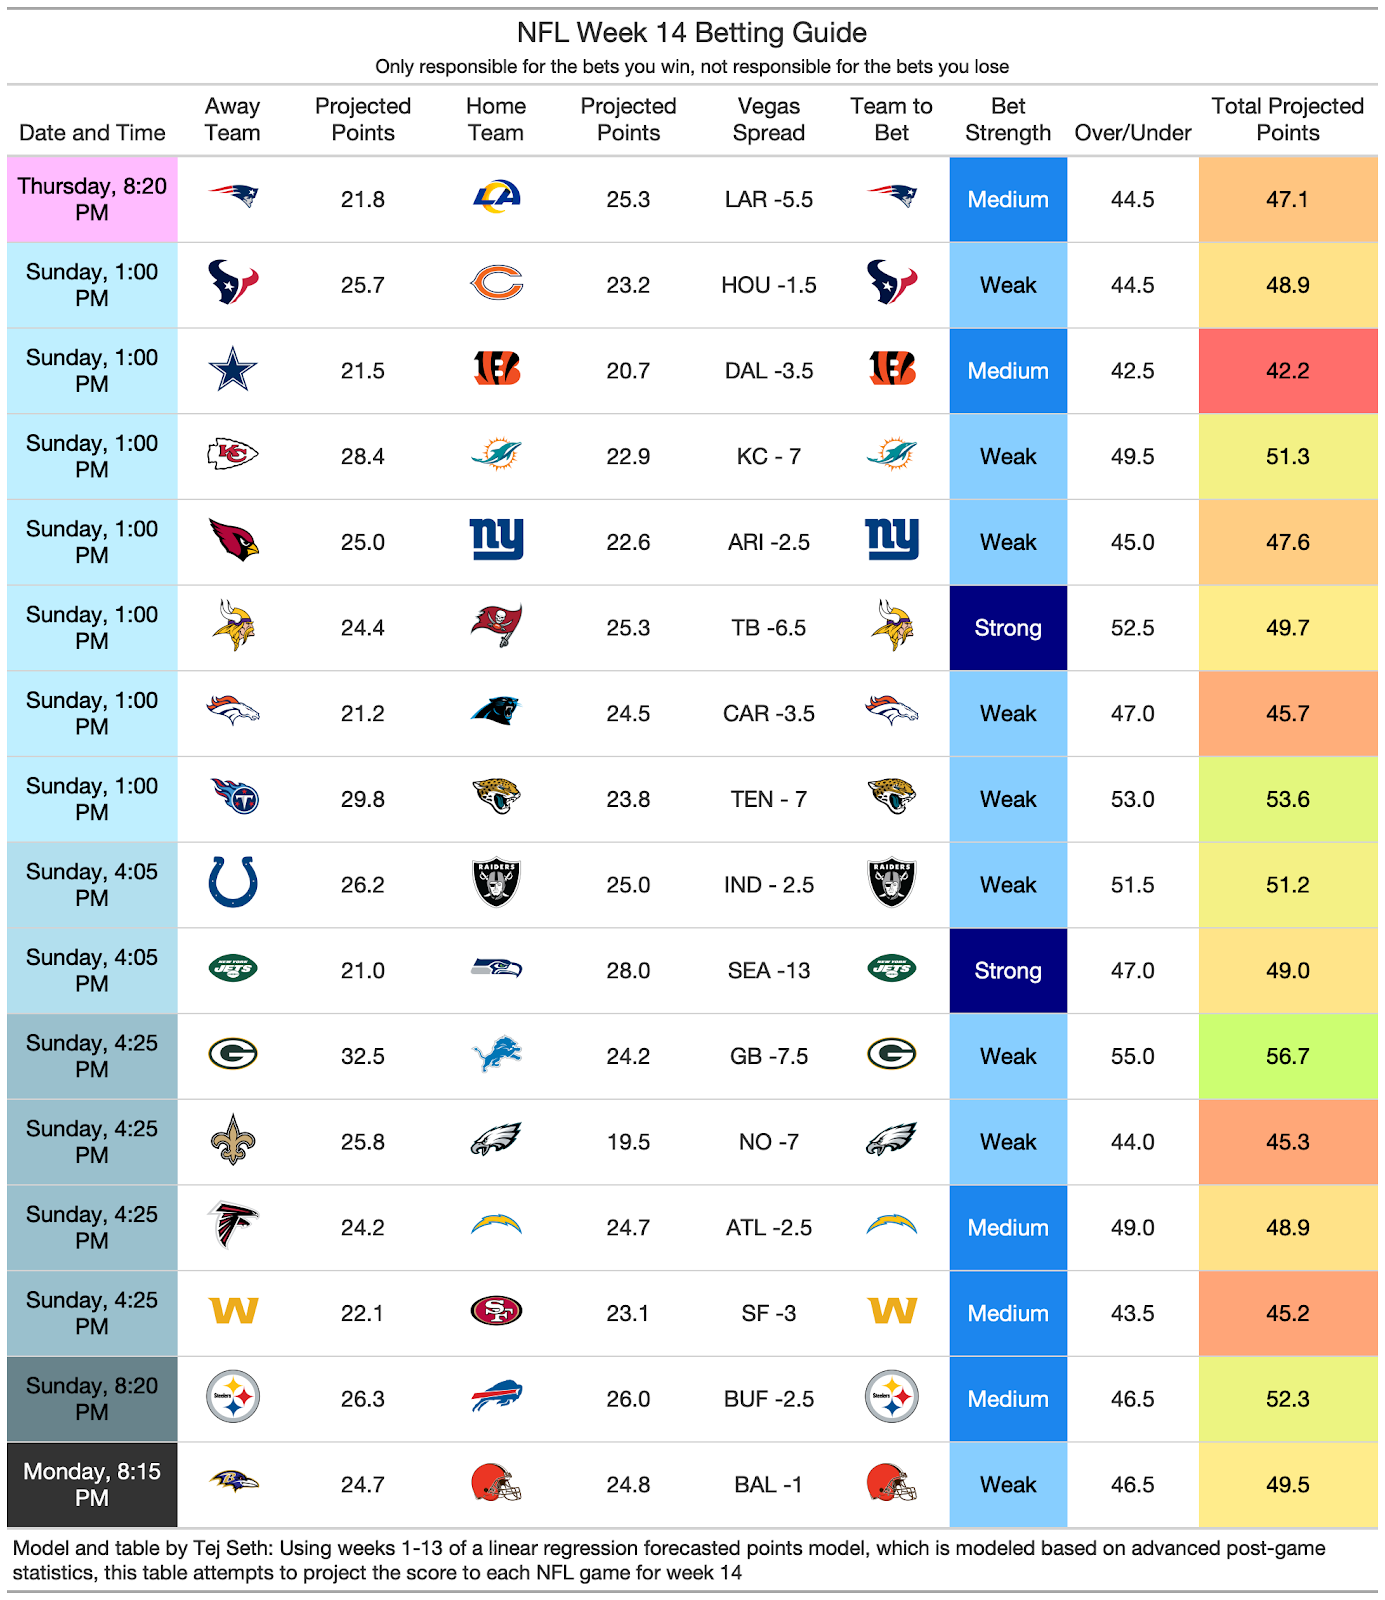
I personally don’t bet because after watching “Uncut Gems” with Adam Sandler I decided I never want to experience that much anxiety while watching football, but I figured other people might find this helpful. Out of the 16 NFL games this week, 14 of my projected score differentials were within +/- 2.5 points of the Vegas spread. I took this as validation I was doing something right. My model only differed strongly from Vegas in two games:
- Vikings +6.5 against the Buccaneers. My model is really high on the Vikings as they have rebounded strongly since their 1-5 start. Kirk Cousins is top 10 in PFF grade, EPA/play and Completion Percentage Over Expected (CPOE) and is playing at an elite level right now. The Buccaneers lead the NFL in variance according to Football Outsiders to anything could happen but 6.5 points is a lot to cover between two playoff teams in the NFC.
- Jets +13 against the Seahawks. To be clear I would never bet the Jets. They are clearly the worst team in the NFL and coming off a big win last weekend as they got closer to Trevor Lawerence (or loss depending on how you look at it). However, Seattle has sputtered recently and is in the average tier of NFL teams right now. The Jets are traveling cross-country but 13 points is a lot for any NFL team to win by.
There are the NFL projections for week 14! They will be updated at the twitter account @mfbanalytics if anything changes. Please feel free to give feedback as I can turn this into a weekly thing if enough people like it. And remember, the betting guide is only responsible for the bets you win and not the bets you lose!
Here is the very messy code on R if you want to look under the hood at my model: https://gist.github.com/tejseth/4653275d30e9cf50e9ffcacd07010858

Nice. I run a multi-variant regression using efficiency stats. Let’s see the difference.
Predicted ATS Winner Result
NE Cover: 4.0 Loss – I actually didn’t like this pick, LAR is better team.
MIA Cover: 1.0
MIN Cover: 3.5
ARI Cover: 0.5
DAL Cover: 1.5
DEN Cover: 0.5
JAC Cover: 3.5
HOU Cover: 1.5
LVR Cover: 1.5
NYJ Cover: 4.5
WFT Cover: 1.0
DET Cover: 7.5
LAC Cover: 6.5
PUSH*
PIT Cover: 0.5
CLE Cover: 1.0
LikeLiked by 1 person
Can you share your code?
LikeLike
Can you Share your code?
LikeLike