There is perhaps nothing more cathartic in sports than complaining about referees. We all do it and hey, maybe by the end of this article you will have more fodder for these complaints. One of the most frustrating situations is when you feel like your team has control of the game and then a few calls don’t go your way and suddenly the opposing team is back in the game. How is that fair? Your team did everything right and now the refs handed the game back to the losing team? Is the feeling that the losing team gets more calls backed up by the numbers?
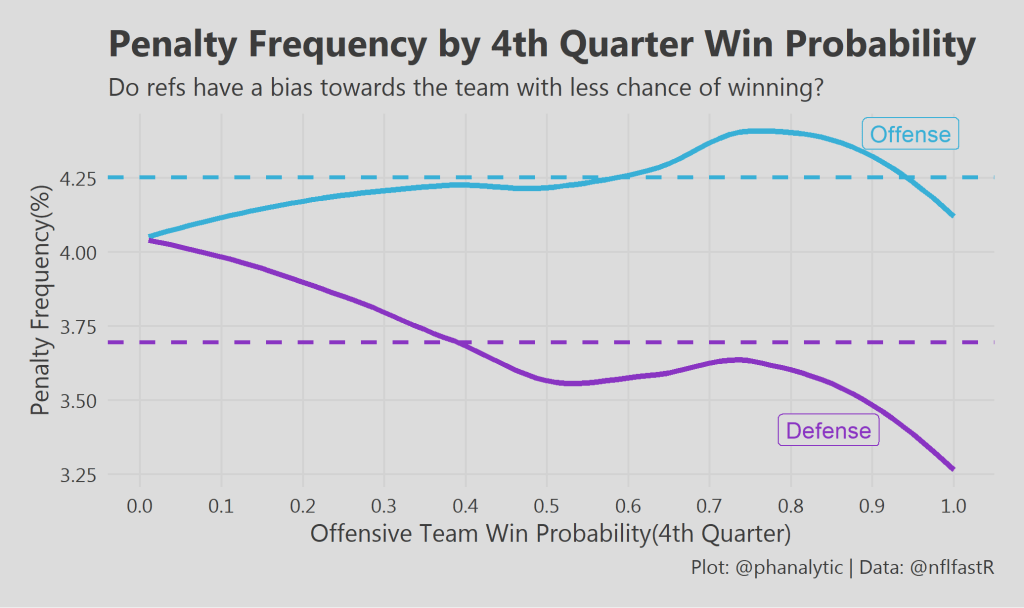
So what are we seeing here? The x-axis represents the offenses win probability(WP) at the time of the play with the y-axis displaying how often penalties are being called against either the offense or defense. A WP closer to 0 means the offense is getting blown out and a WP closer to 1 means the offense is in control of the game. For reference, the dashed lines represent the average penalty rate so we can observe at what points penalty rates are above or below the average. From this graph alone, we can conclude that defenses are called for more penalties when they have a higher probability of winning. As this probability decreases, their penalties decrease, which coincides with an increase in offensive penalties. So that’s all folks, refs are biased towards the losing team and I hope you enjoyed my first article.
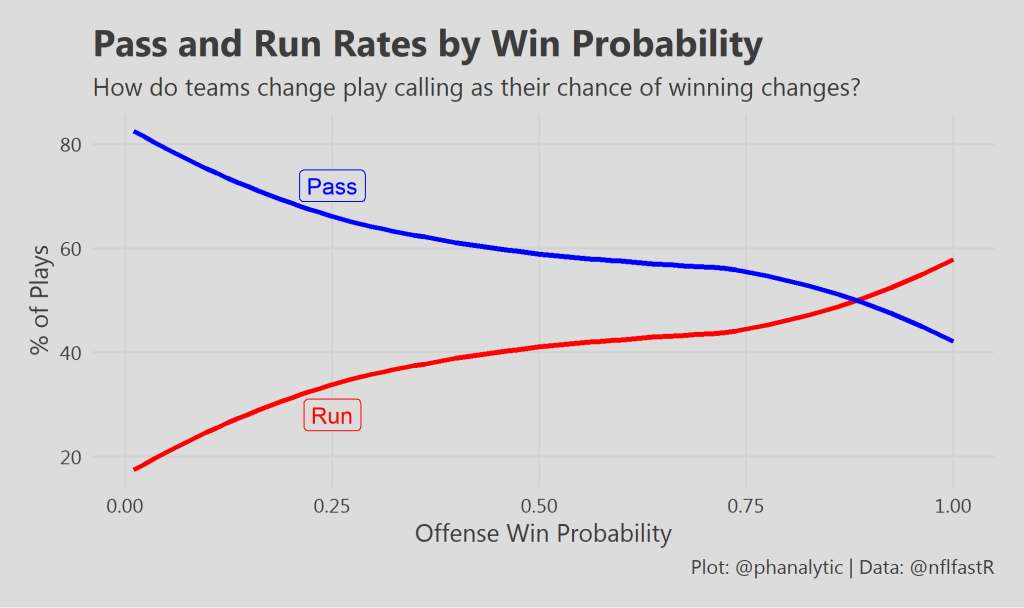
If only it was that easy… an issue we face here is that play calling changes along with win probability and to display that here is a quick look at pass and run rates by win probability.
The takeaway here? Teams run the ball more when they have a higher chance of winning because they’re running out the clock(take notes all the stat makers who use “team x is 7-1 in games where player y gets x # of carries or more”). If you want to see another look at this check out this graphic by @adrian_cadem. The reason this matters in the context of examining penalties is because runs and passes draw penalties at different rates. We see below that on passes, defenses are called for more penalties while offenses are called for less and this flip-flops for run plays. Yet another reason why passing the ball is beneficial.
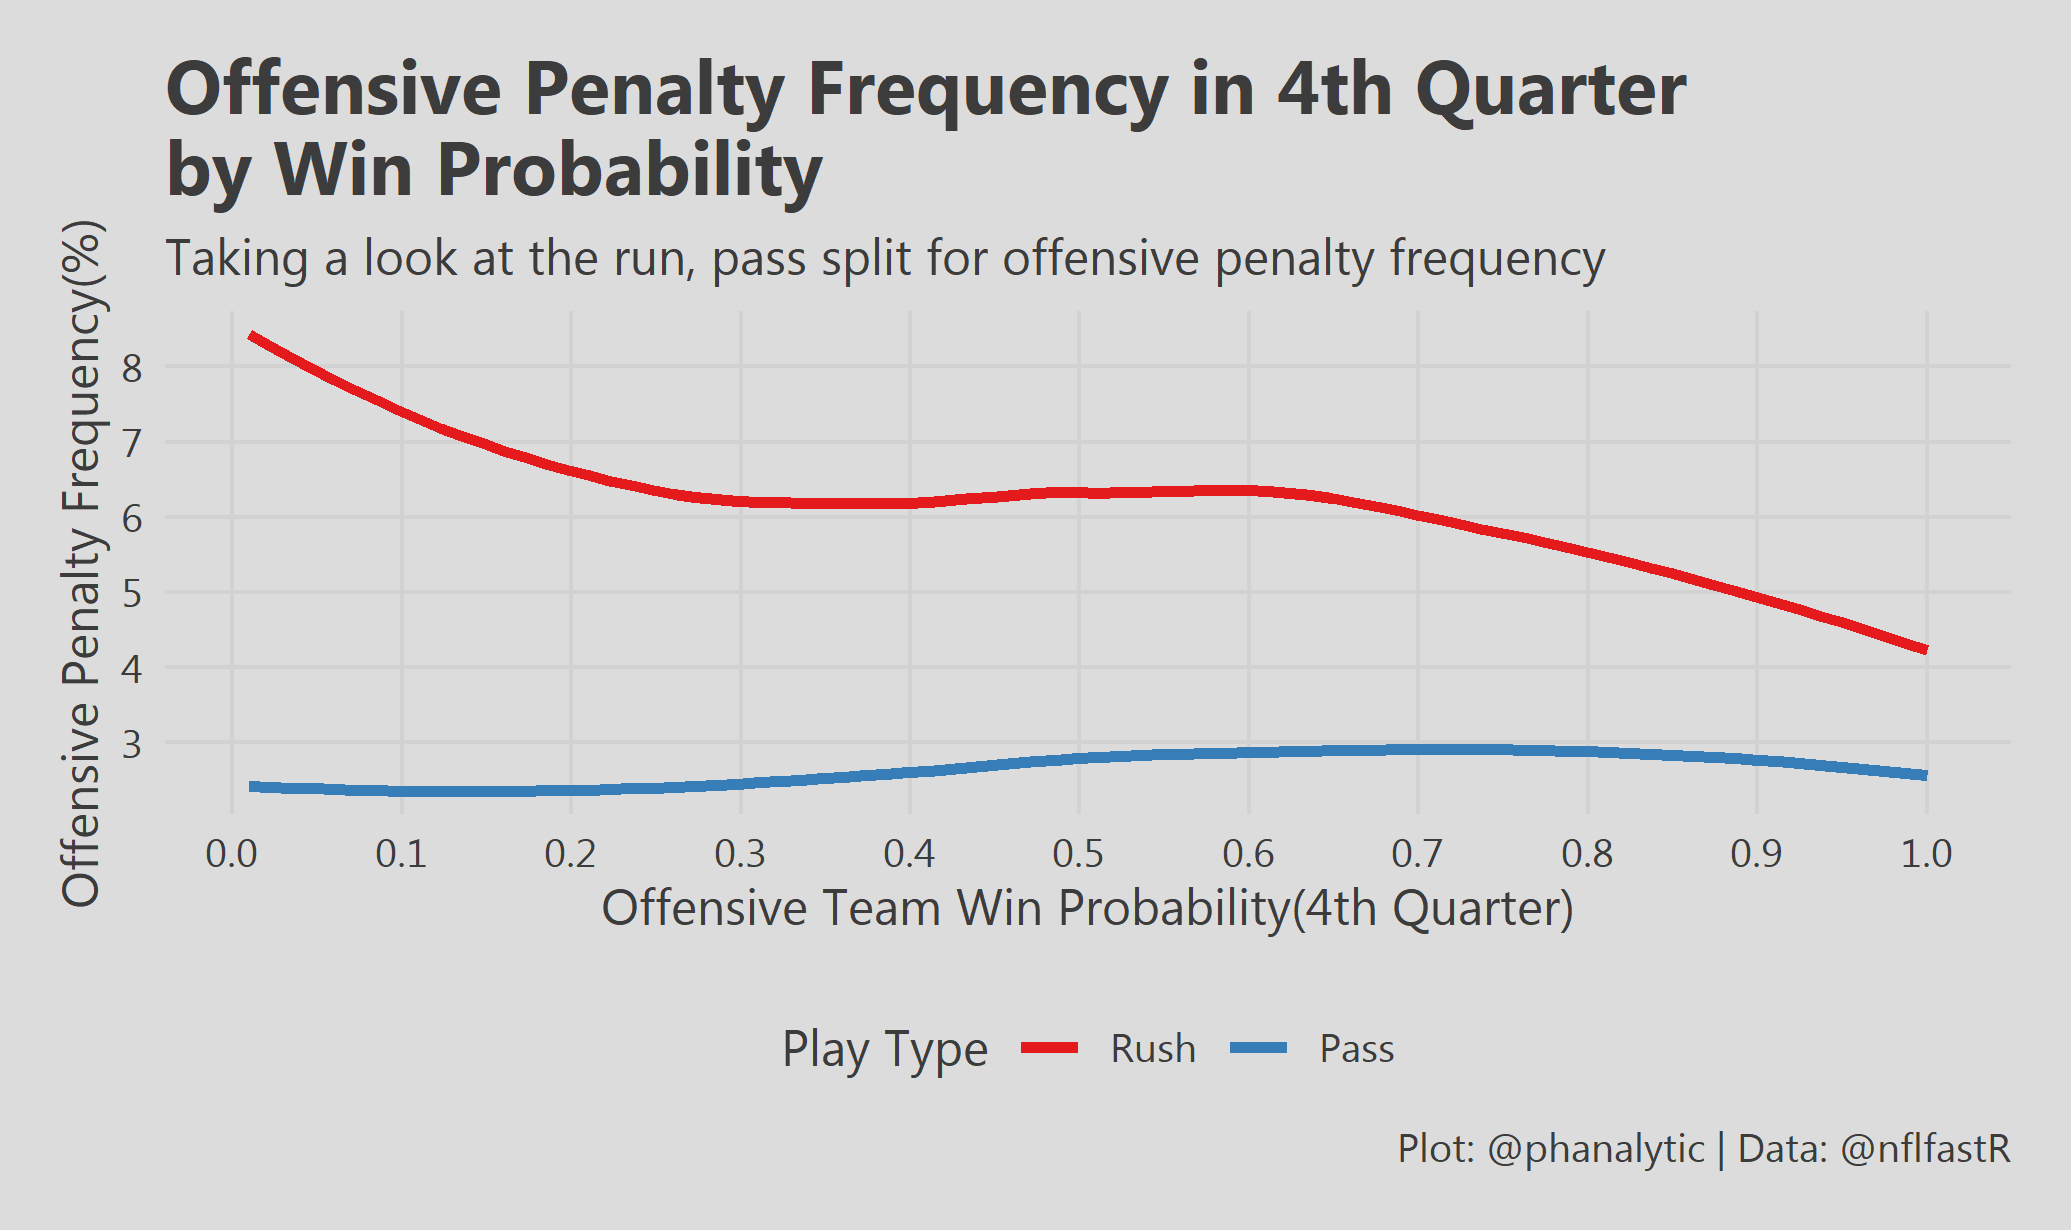
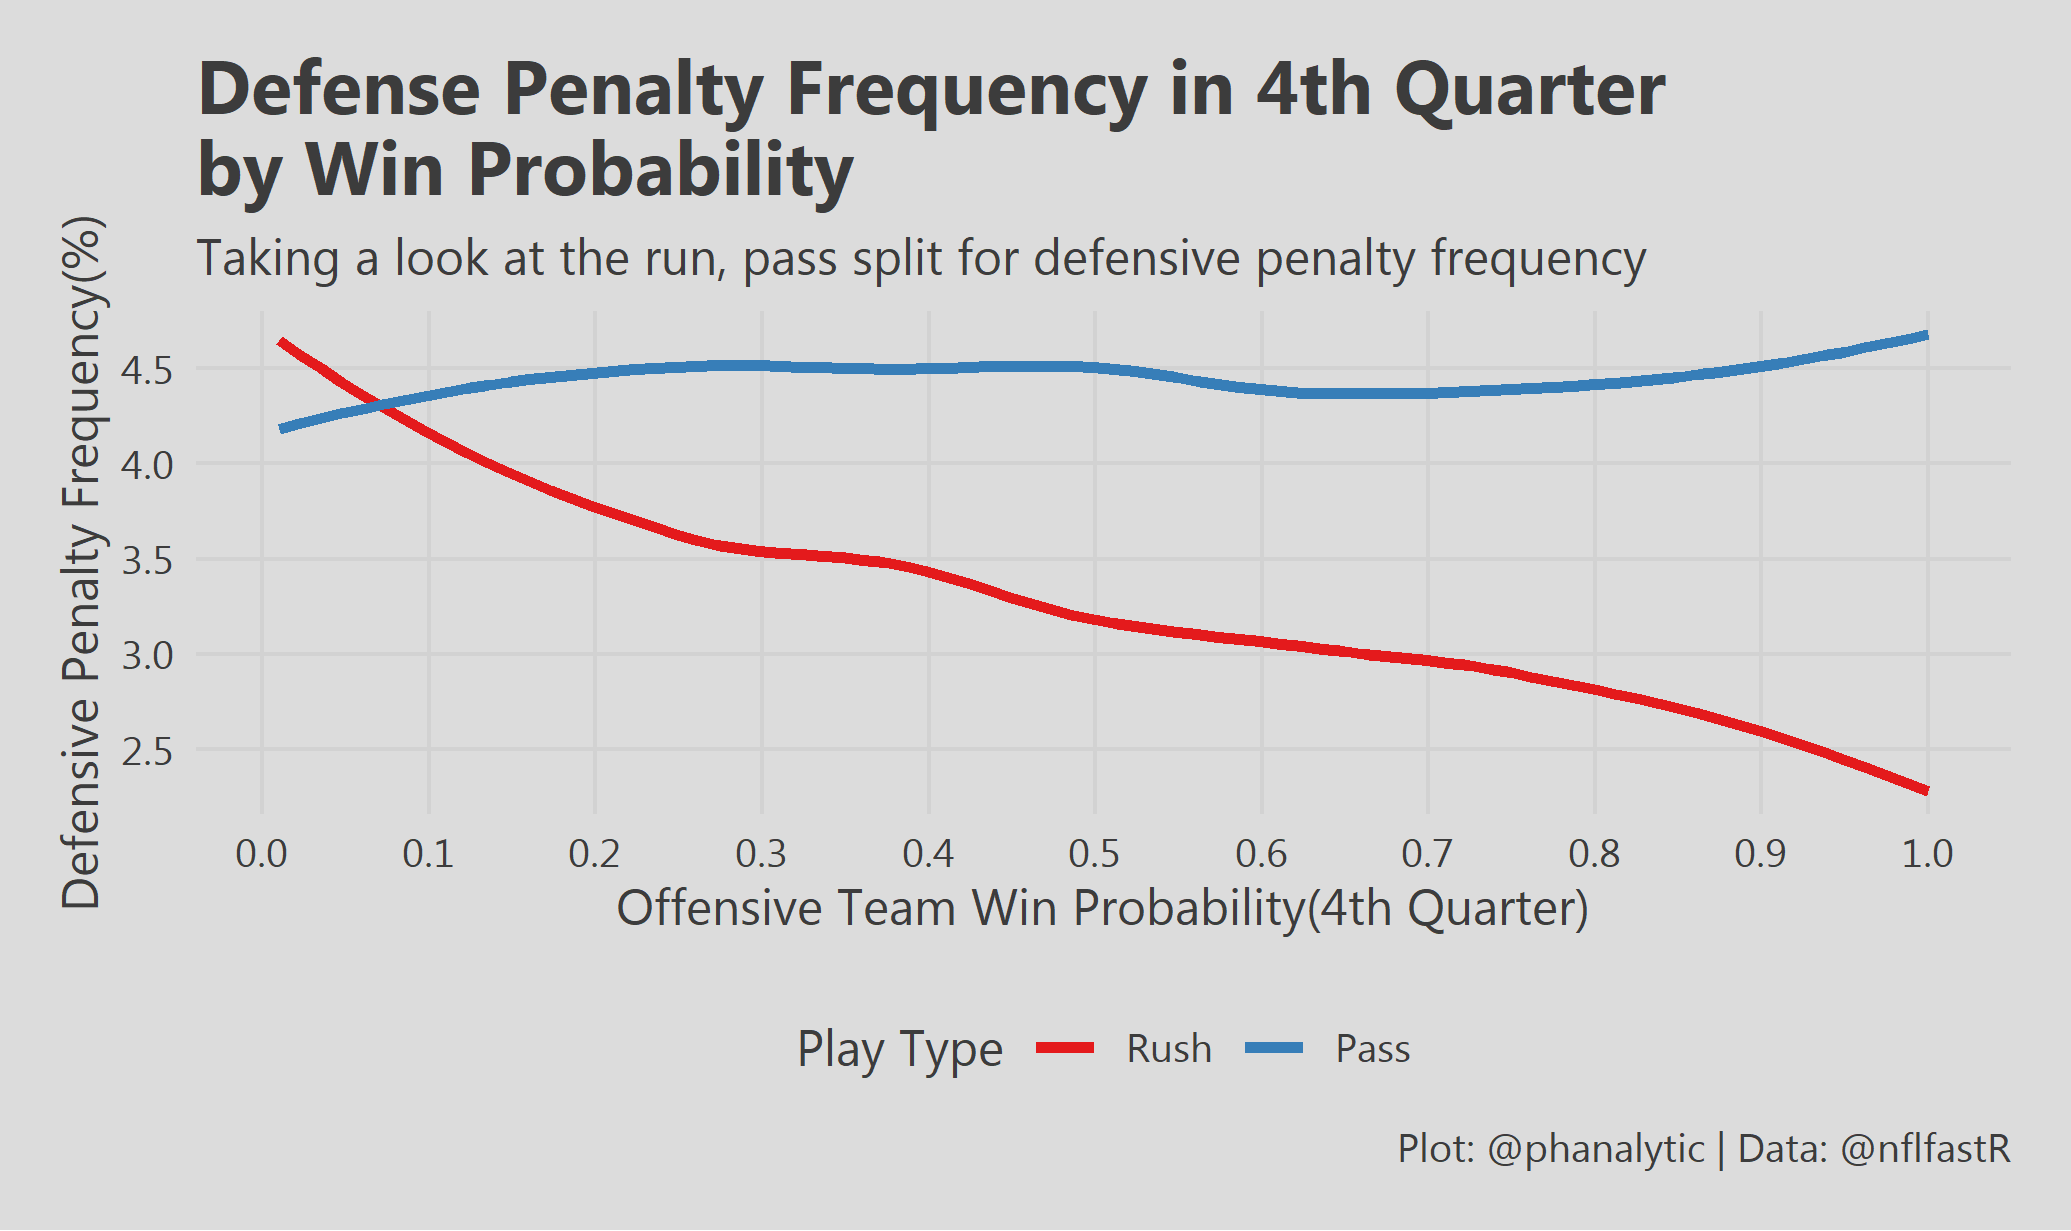
Outside of the discrepancy is penalty rates between the two play types, we observe that penalties on pass plays are more stable than rushing penalties. It is also of note that as offensive WP increases the difference in penalty rates between rush and pass plays decreases for the offense but increases for the defense. This stark difference on defensive plays is curious, so let’s examine this further.
There are a couple other reasons why I’m choosing to focus on defensive penalties. First, there are more subjective defensive penalties (e.g. Defensive Pass Interference, Unnecessary Roughness, Roughing the Passer, etc.). These types of penalties are more interesting to study because referees hold more discretion on these and hence we may see more variability. Second, many of these penalties are automatic first downs that make a huge impact on the landscape of the game.
To alleviate some of the bias that occurs from play calling(pass vs rush), we can look solely at penalties that primarily occur on passing plays.
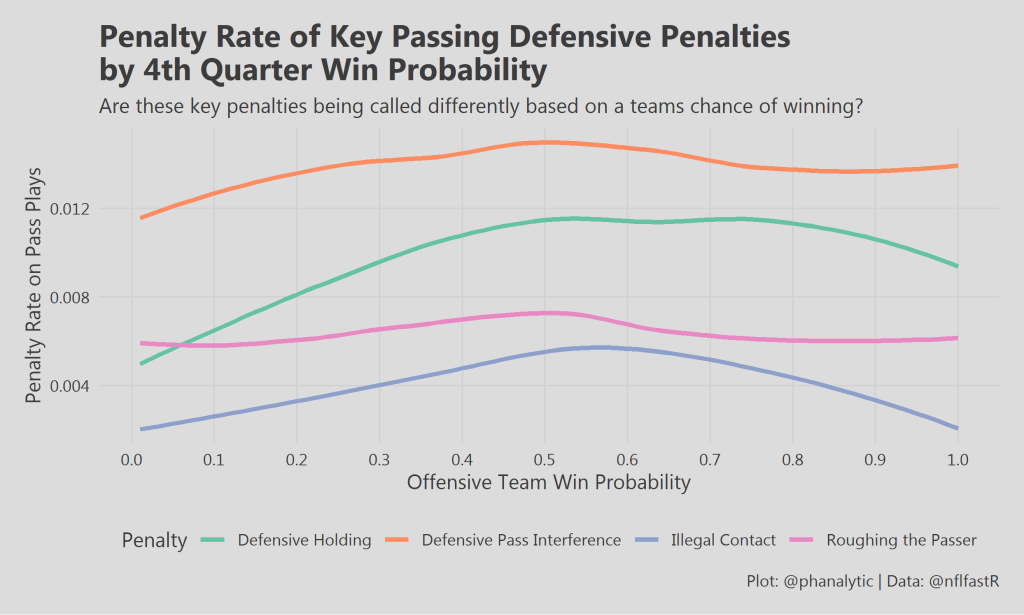
We do see a bit of a trend here. When the offense has a lower chance of winning the major defensive penalties are being called at a higher rate. Once the offense takes the upper hand (WP > .5) the defensive penalties level off or even decrease. The most clear-cut examples of this are roughing the passer and illegal contact where we see a peak between .5 and .6 WP and then a decline afterwards.
So the question now is, “So what? Even if there is a trend, why does it matter?”. Well the fact is these are significant penalties and if there is in fact a tendency to give the losing team the call that is an issue. Here is a table showing the average Expected Points Added (EPA) and Win Probability Added (WPA) of the penalties shown above:
| Penalty Type | Mean EPA | Mean WPA |
| Defensive Holding | 0.90 | 0.03 |
| Defensive Pass Interference | 1.74 | 0.05 |
| Illegal Contact | 0.85 | 0.02 |
| Roughing the Passer | 1.78 | 0.05 |
For context the average EPA of a completed pass is .41 with a WPA of .01, less impact than any of the penalties above. To be fair this isn’t an equal comparison given the above penalties are providing a first down. If we narrow our focus to just completed passes that resulted in first downs we get an average EPA and WPA of 1.65 and .04 respectively. With this benchmark to compare to, the impact of these penalties is significant. Essentially, these plays are equivalent to passing for a first down and in some cases even more impactful.
Key Takeaways and Conclusions
One thing that is clear here is that there is a trend in which penalty rates of key defensive penalties are gradually increasing when the offense has a lesser chance of winning and peak in game neutral situations. The cause is inconclusive as there is one key factor that isn’t considered here. How often are teams committing penalties? With the data available one can observe how often teams are called for penalties but without knowing whether or not teams are committing them we must carry on with the assumption that the referees are making the correct call. Perhaps teams are just committing more penalties when the game is tighter and that explains why more are being called. Teams and players are likely playing harder in these moments and this in itself can lead to over aggressiveness and the committing of more penalties.
Nevertheless, the outcome of this does provide insight into how games are called. In a generalized sense we can conclude that referees are calling games tighter when the game is close and giving the benefit of the doubt to the team with a lower chance of winning. For now, if my Eagles are winning a game and I see the opposing team get a call you already know the first words coming out of my mouth are “That damn Win Probability Bias!!”
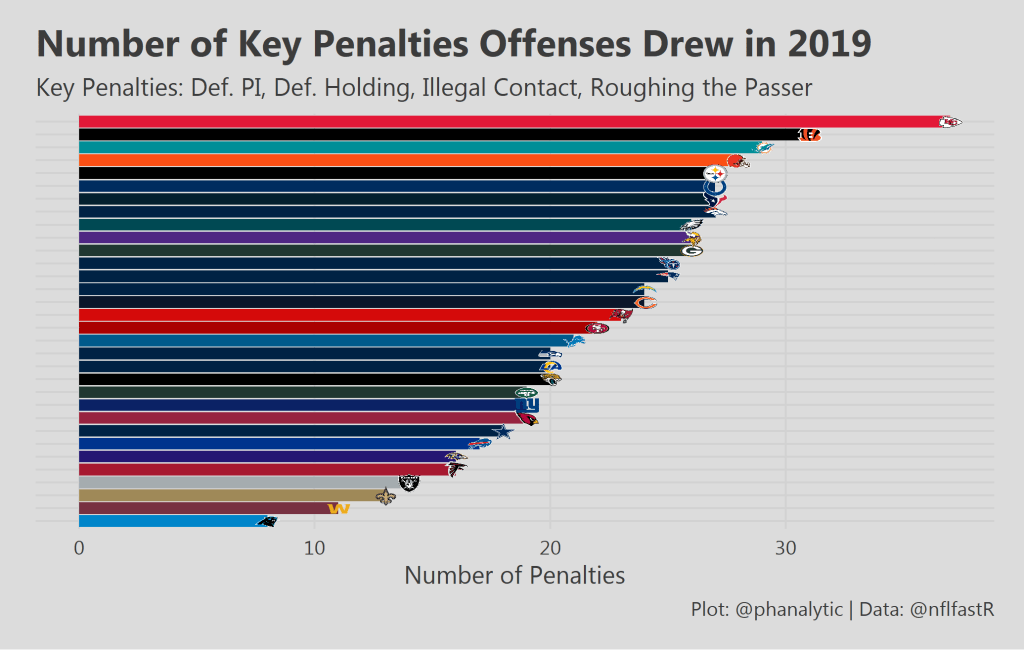
If you are curious how your teams’ offense did in regards to benefiting from these type of penalties last year, check out this graph below:
Thanks for reading and follow me @phanalytic and our website @mfbanalytcs for more deep dives like this!
