
Not all positions in football are equal. Nearly every fan, player, coach, and executive would tell you that you can’t win without a good quarterback, but you’d be hard pressed to get them all to agree that you also need a good guard to win. So, how important is every position?
Andrew Hughes, Cory Koedel, and Joshua A. Price of University of Missouri and Southern Utah University attempted to empirically answer this through Positional WAR (pWAR). pWAR measures how many additional games a team would lose by a starter at a certain position missing starts due to injury or suspension. Effectively, the results of their research demonstrated how valuable each position is.
Hughes, Koedel, and Price looked to answer at how many starts players at each position missed for several seasons and see how many games the teams lost during those missed starts. Their model did not account for multiple injuries at different positions, or for players who were benched. Even still, it lets us see what the relative value of different positions in football are:
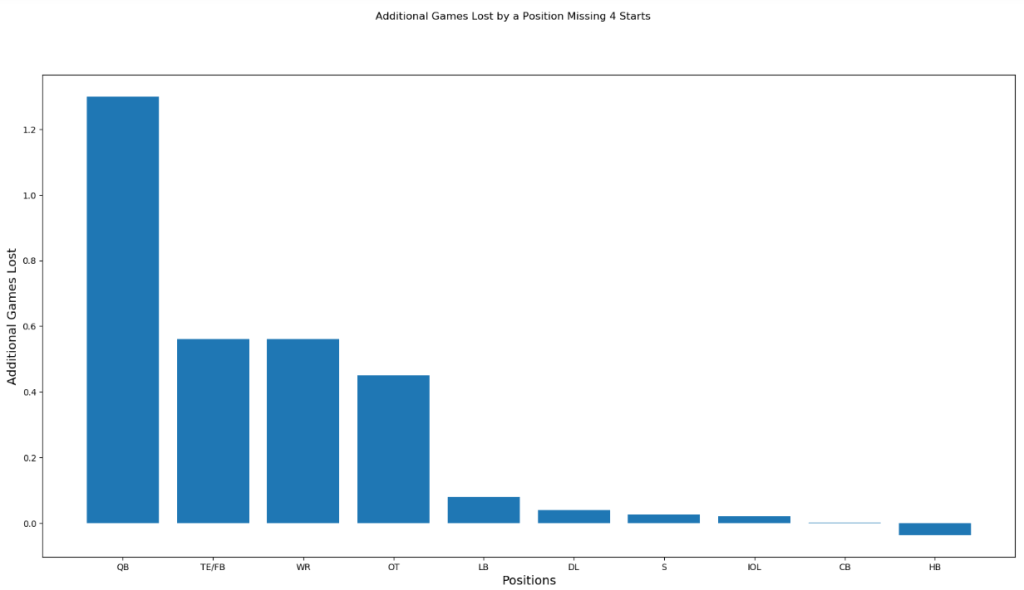
This graph shows how many more games a team would lose, on average, if they lost a starter at a given position missed exactly 4 games. For example, if a team had a starting quarterback miss 4 games they would, on average, lose 1.3 more games than they would otherwise over those 4 games.
Several positions were combined so that they would have statistical power. That means that splitting defensive linemen between edge defenders and defensive tackles made it too likely that a difference in those players missing starts wouldn’t be noticed.
This graph can be alarming. There are two main groups of positions: the higher pWAR group of WRs, TE/FBs, and OTs and the lower pWAR group of all defenders, RBs, and IOLs. The reason behind their pWAR gap is that the lower group can have adjustments in scheme to compensate for their loss. For example, if a defense loses a cornerback, then the coverage assignments of safeties and linebackers can be adjusted in order to alleviate what is required on the replacement.
An extremely important point is that this is not the be all end all for individual player value. There are still many examples of individual players at a low pWAR position being more valuable than players at high pWAR positions. This says that when two starters of equal relative quality, then the player at the higher pWAR position is more valuable, but a player of higher quality at a lower pWAR can be more valuable than a player of worse quality at a higher pWAR. In other words, Julio Jones is more valuable than Aaron Donald, but Aaron Donald is still more valuable than Andre Smith.
From here we can create a framework of how to value free agents with a core assumption: between any two players of equal quality, the player at the higher pWAR position should be paid more. Additionally, it is a small logical leap to say players of an All-Pro quality should be paid more than those of a Pro Bowl quality, which should be paid more than starters, which should be paid more than backups. From here we can make a tier system of paying players:
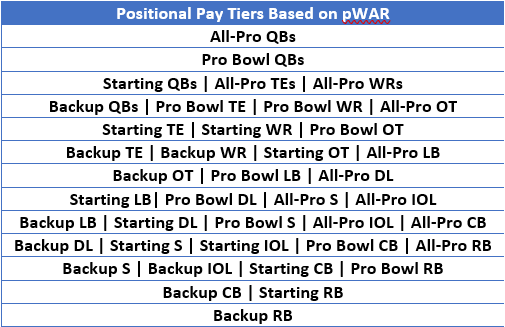
Players in the same tier should be paid the same, so backup cornerbacks and starting running backs should be paid the same amount according to this. This is not perfect, as there are many arguments based on pWAR that the gaps between position groups should be more pronounced in several places. However, this should work as a good enough approximation on how teams should allocate resources according to pWAR.
We can apply this to each team’s every signing this offseason to see how well each team followed it. I gave a grade of backup, starter, Pro Bowl, or All Pro to every free agent signing, resigning, and trade with details released as of March 28th.
A player got a backup or starter grade depending on what they are projected to be next season. This is determined depending on other additions and losses on the team, playing time from last season, and other similar factors. For practical purposes, there will not be any distinction between 2nd and 3rd string backups. A player got a Pro Bowl or All-Pro grade if they were named to either in the past two years. If they were named to both in the past two years, they were considered an All-Pro. This doesn’t count for Xavier Rhodes, he received a backup grade since he performed so poorly last season.
After every player was given a grade, they were then associated with the tier of their grade. The players were then ranked according to how they should have been paid according to their tiers. The players were then re-ranked according to how they were actually paid. The difference between the two rankings were then taken and called Spending Efficiency (SE) for each player and averaged for each team. A positive difference indicated that the player was signed for less than their tier indicated, and a negative difference indicated the opposite. This statistic will be called Average Spending Efficiency (ASE). This is best illustrated with an example:
Kyle Van Noy was given a starting LB grade, which placed him in tier 8. Since the Dolphins signed two backup WRs (tier 6), Van Noy should have been their third highest paid player. He was given a contract with an AAV of $12.75 million, which was the Dolphins second highest paid contract. So this signing got a SE of -1. AAV may not be the best measure, but it indicates generally how teams have invested their resources. For players that were traded for, the AAV of the assets traded for was included in the calculation.
Before we get to the results, the Jets, Eagles, and 49ers were not included in this research since not enough of their contract details have been released. FB signings were ignored since so few were signed at such a cheap rate that the results would be massively skewed towards the teams that just signed a FB. Additionally, only signings with details released were considered for calculations, so players such as starting WR Philip Dorsett for the Seahawks were not included. This does not also indicate if the teams allocated their resources to the right players, just in the right distribution.
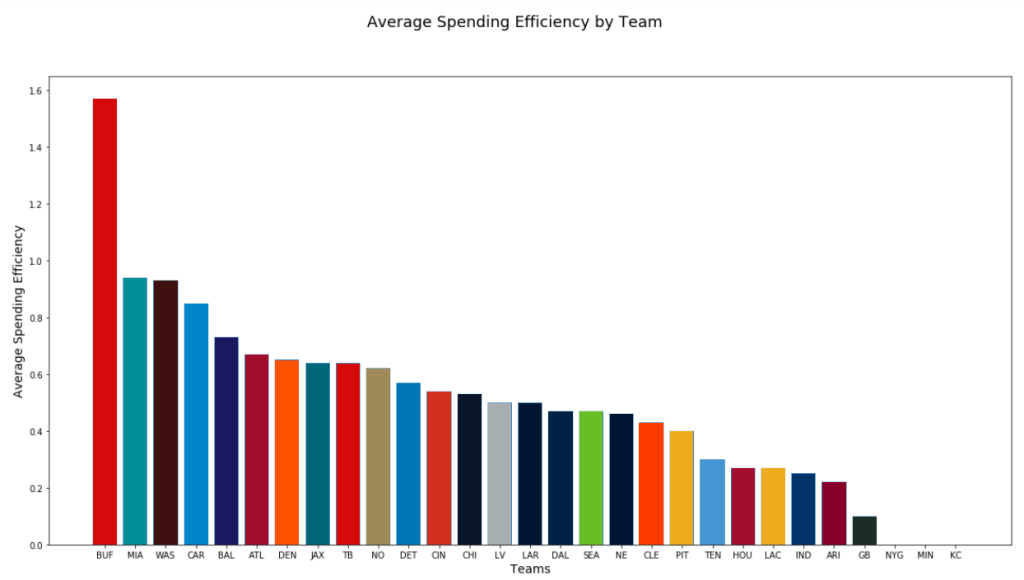
Without any further ado, here are the results:
T29. Kansas City Chiefs (ASE = 0)
The ASE model does not appreciate the signing of Chris Jones to the biggest deal of the Chief’s offseason, assuming that they retain him over the coming weeks. The model also didn’t appreciate backup CB Antonio Hamilton not getting the smallest contract of the signings, but their scored is saved by the small contracts of backup TE Deon Yelder and QB Chad Henne. As they should’ve been the 2nd and 1st highest paid players respectively.
T29. Minnesota Vikings (ASE = 0)
The two largest blows to the Viking’s score are starting Safety Anthony Harris signing the second largest contract and run stuffing starting DL Michael Pierce to the 3rd largest deal. They should have been paid as the 7th, 8th, and 5th respectively according to the model. The Vikings score is equally saved by the small contracts given to important backups and starters, namely backup QB Sean Mannion, starting WR Tajae Sharpe, and backup OT Rashod Hill. This is the first instance we see of teams really taking advantage of signing backup WRs and QBs to small contracts. It is important to note that if Tajae Sharpe becomes a backup WR then the Vikings will become the only team to date to overspend on players on average.
T29. New York Giants (ASE = 0)
The model has an active love-hate relationship with Dave Gettleman’s vices in life. Those being big bodies in the trenches, linebackers, and refusing to pay wide receivers. The model unsurprisingly hated the signing of starting DL Leonard Williams to the largest contract on the team, as well as backup DL Kyler Fackrell (for the purposes of this edge defenders are considered DL). Starting CB James Bradberry, however, had one of the worst signing efficiencies of any single signing this offseason as the model dictated he should’ve been the 13th highest paid player for the Giants when he was the 2nd highest. The cheap contracts given out to backup OTs Eric Smith and Chad Slade partnered with backup QB Colt McCoy’s and backup WR Cody Core’s small deals buoyed up the Giants from overpaying on average. It stands to note that if Kyler Fackrell ends up becoming the starter, the ASE will be slightly bigger, but the Giants would stay among the league’s lowest.
26. Green Bay Packers (ASE = 0.1)
I’m projecting Devin Funchess to start at WR for the Packers next year, which assumes that either the Packers don’t draft a WR early in the draft, or that he would beat out any rookie. If he does become a backup, the Packers ASE will dip even further to even with the Giants, Chiefs, and Vikings. The signings of backup RB Tyler Ervin and starting LB Christian Kirksey were the most overpaid according to the model. Ervin was supposed to be the 10th highest paid, when he was the 5th and Kirksey was supposed to be the 7th highest paid when he was the 1st. Luckily, the Packers signed backup WRs Allen Lazard and Jake Kumerow to cheap deals to save their score.
25. Arizona Cardinals (ASE = 0.22)
The largest contribution to the Cardinal’s score is the acquisition of All-Pro WR DeAndre Hopkins while also managing to shed David Johnson’s terrible contract. The model absolutely adores that move. It also loves the astoundingly cheap contract give to starting OT Justin Murray at less than a $1 million. Even if Murray doesn’t start for the Cardinals next season the model still loves the contract. Unfortunately, as much love as there is for these two contracts, it hates the large contracts given to starting RB Kenyan Drake and starting DL Jordan Phillips. This is a case where classic football understanding and the model disagree, as the Cardinals were much more efficient with Drake on the Field and had an awful run defense. Even with those facts, it appears that it would’ve been ideal if the Cardinals would have spent those resources elsewhere.
24. Indianapolis Colts (ASE = 0.25)
The Colts were exactly in line with the model with the deals given to Philip Rivers being the most expensive and starting OT Anthony Castanzo being the 3rd most expensive contract this offseason. Unsurprisingly, the model is critical of the trade for All-Pro DL DeForest Buckner. When factoring in the AAV of the traded away 1st round pick, Buckner essentially cost the team as much capital as did signing Rivers which the model gave the most negative score for the Colts. The Colts score was saved by a cheap contract given to backup TE Mo Alie-Cox and an astoundingly cheap contract given to starting WR Zach Pascal. As an aside I don’t understand Pascal’s contract, he is getting paid less than a million dollars next year, and unless WR Parris Campbell emerges next season or they draft a WR and expect him to step in right away as a starter he will most likely start next year. I just don’t understand, and their ASE is better off for it. If he ends up as a backup the Colts will switch places with the Cardinals.
T23. Los Angeles Chargers (ASE = 0.27)
The Chargers, much like the Colts, orchestrated a major trade this offseason swapping starting OT Russell Okung for Pro Bowl IOL Trai Turner with the Panthers. Due to the difference in pWAR between IOL and OTs, the model has deemed the Chargers the loser of the trade with Trai Turner yielding the same SE of 5 although he cost the Chargers $-2 million in AAV. This is also in some part due to the Chargers have not making many moves this offseason, so Turner’s SE is minimized. It also doesn’t help that the model hates the contracts given out to starting HB Austin Ekeler and Pro Bowl CB Chris Harris. These are counter balanced in part by the Turner trade, but also by signing projected starting OT Trent Scott to a $750k deal. In the likely event that Scott becomes a backup this season for the Chargers, their ASE will drop to 0.18 putting them between the Packers and Cardinals.
T23. Houston Texans (ASE = 0.27)
The Texans managed by the Notorious B.o.B. have somehow become the only team in the NFL thus far to overpay for a WR by this metric, after trading away an All-Pro WR. They should’ve paid starting WR Randall Cobb as the second highest paid player this offseason but elected to rather making him their highest paid player by a margin of more than $2 million. The signing of backup WR DeAndre Carter to a dirt cheap contract as well as the relatively small deal given to starting TE Darren Fells. They also serve as a good case study as to how little the model cares for running backs, as getting starting RB David Johnson for a net negative AAV has the same SE as the deal given to backup QB AJ McCarron being the 3rd largest.
21. Tennessee Titans (ASE = 0.3)
Unsurprisingly, the model heavily disagrees with the deal given to All-Pro RB Derrick Henry, as he got the 2nd largest deal when he was projected to get the 8th largest deal. Additionally, the deals given to starting DL Vic Beasley and backup CB Chris Milton were larger than their projected contractual worth. These overpaid deals are counteracted by the cheap deals given to backup QB Logan Woodside and backup WR Cameron Batson, which each have a SE of 7. Additionally, it’s noteworthy that the model sees nothing wrong with the contract given to Pro Bowl QB Ryan Tannehill.
20. Pittsburgh Steelers (ASE = 0.4)
Unlike the prior teams, the Steelers did not make any single move that the model felt very strongly about. The worst signings, according to the model, were giving the franchise tag to starting DL Bud Dupree giving him the largest contract of the Steelers offseason, and making starting CB Mike Hilton the 4th highest paid player of the Steelers’ offseason. Neither of these contracts were considered egregious, however, with SEs of -4. In the event Dupree gets a long-term deal, it would not affect the Steelers’ ASE as long as he was paid more than backup TE Eric Ebron. The resources invested into starting DL Chris Wormley and backup DL Tuzar Skipper who each ended up with SEs of 3. Even if Chris Wormley ends up becoming a backup for the Steelers they’d end up with the same ASE. The Steelers are one of the only teams this offseason who invested significantly in the DL and were not punished for it.
19. Cleveland Browns (ASE = 0.43)
Of the three biggest contracts the Browns gave out this offseason, the only one which the model viewed poorly was starting OT Jack Conklin getting the largest contract, receiving an SE of -2. The most egregious contracts they doled out this offseason were to backup CB Kevin Johnson and backup HB Kareem Hunt, each of which received a SE of -7. These two contracts drag the Browns score much lower than Jack Conklin’s deal. Like many other teams in the NFL, however, signing backup WRs Jojo Natson and KhaDarel Hodge and backup TE Pharaoh Brown to cheap deals were great for the model as they all received an SE of 7 or 8. In the event that CB Kevin Johnson becomes a starter, the Browns’ ASE would not actually change, as the bigger vice in the model’s eyes is not making the backup RBs signed by the Browns the lowest paid players.
18. New England Patriots (ASE = 0.46)
In a somewhat surprising revelation, the Patriots are nowhere near the top of this list as they are with most advanced analytical studies. The Patriots have invested heavily into the interior offensive line and safety positions and this did not serve the model well. Across all their IOL signings (all-pro Joe Thuney and backup Jermaine Eluemunor) they accumulated a total SE of -8, and across their S signings (starter Devin McCourty, All-Pro* Adrian Phillips, and backup Cody David) they accumulated a total SE of -10. This would tank many other teams, however the relatively small contracts given to starting WR Damiere Byrd and backup QB Brian Hoyer saved the score of the Patriots with their net SE of 18.
*Adrian Phillips was named an All-Pro as a special teamer. I am still considering him an All-Pro because of Bill Belicheck’s well known importance put on the special teams’ unit. If you disagree with this decision and consider Phillips a backup S then the Patriots ASE is 0.38, placing them between the Steelers and Titans.
T17. Seattle Seahawks (ASE = 0.47)
The Seahawks are nearly the opposite of the Patriots with wild swings in SE. The investments into starting CB Quinton Dunbar, backup IOL BJ Finney, and starting DL Jarran Reed were destroyed by the model with SEs of -8, -7, and -6 respectively. The Seahawks, however, did not invest many resources into their receiving corps and this greatly helped their ASE. In particular, the signings of backup WRs Malik Turner (SE = 9) and David Moore (SE = 6) help to buoy up their score. These signings combined with the rest of their generally positive SE signings (backup DL Bryan Mone, backup LB Emmanuel Ellerbee, starting TE Greg Olsen, etc) gave the Seahawks their middling ASE.
T17. Dallas Cowboys (ASE = 0.47)
The two biggest signings of the Cowboys offseason, franchise tagging Pro Bowl QB Dak Prescott and signing Pro Bowl WR Amari Cooper to a big deal, were viewed as “correct” by the model as both received a SE of 0. The same cannot be said about the contracts awarded to starting DL Gerald McCoy and backup CB Anthony Brown with SEs of -4 and -9 respectively. If Anthony Brown ends up starting for the Cowoys, his SE will end up only as -7, still very bad, but the Cowboys’ ASE will rise to 0.58. Most of the Cowboys positive signings reside on the defensive side of the ball, which is an oddity in the NFL. The largest SE of the Cowboys is backup QB Cooper Rush’s 7, but the next two highest reside with backup LB Justin March and backup DL Antwaun Woods with SEs of 6.
T15. Los Angeles Rams (ASE = 0.5)
The Rams, at time of writing, have only made 6 signings. Three of these signings (starting OT Andrew Whitworth, starting DL A’Shawn Robinson, and backup IOL Coleman Shelton) were considered “correct” by the model with a SE of 0. The signings of starting DL Michael Brockers (SE = 1) and backup TE Johnny Mundt (SE = 4) were considered good by the model. Only one of their signings, that of starting DL Leonard Floyd, were considered negative with an SE of -2.
T15. Las Vegas Raiders (ASE = 0.5)
The Raiders’ score manages to take full advantage of signing WRs and QBs to extremely cheap deals to cover up some of the worst deals in the NFL according to the model. The model absolutely despises the deals handed out to backup RB Jalen Richard (SE = -12), starting CB Eli Apple (SE = -10), and starting IOL Richie Incognito (SE = -8) all of which rank amongst the worst in the NFL. The Raiders are only then saved from being among the bottom of the NFL according to ASE thanks to the incredibly small deals given to backup QB Nathan Peterman (SE = 12), starting WR Nelson Agholor (SE = 14), and backup WR Keelan Doss (SE = 16). All of these rank amongst the highest SE deals in the NFL. In the event that Nelson Agholor becomes a backup, his individual SE goes down, but the Raiders’ ASE would rise to 0.68.
13. Chicago Bears (ASE = 0.53)
The Bears have been criticized for their pickup of Nick Foles over other options on the market, but the ASE model at least thought the assets invested into Foles was appropriate regardless of whether he starts over or backs up Mitchell Trubisky. The Bears really excelled, however, in the TE market where all of their signings (starter Jimmy Graham, backup Demetrius Harris, and backup JP Holtz) had positive SEs with a net of 18. Unfortunately, they equally failed in the defensive back market with All-Pro S Eddie Jackson, backup S Deon Bush, backup S Jordan Lucas, and backup CB Artie Burns netting a SE of -14.
12. Cincinnati Bengals (ASE = 0.54)
The Bengals have been heavily criticized by prominent football analytics outlets for the signings of starting CB Trae Waynes, and starting DL DJ Reader. The ASE model does not appreciate these signings either, but to a much lesser degree as Waynes got an SE of -5 while Reader only got an SE of -1. Where the Bengals excelled, like many other teams, is by signing backup TE Cethan Carter (SE = 5) and backup WR Mike Thomas (SE = 10) to cheap deals. Interestingly enough, the Bengals are one of the few teams in the NFL to correctly value a starting WR in franchise tagging AJ Green this offseason, but still sign a backup WR, Mike Thomas, to a disproportionally small deal.
11. Detroit Lions (ASE = 0.57)
Independent of trading Darius Slay, the model did not appreciate the contract awarded to his replacement starting CB Desmond Trufant with an SE of -7. Other then that, however, the Lions made any signings that disagreed with the model. Their issue was when they took advantage of the model, they did not do so to a large extent. For example, their largest positive SE moves were the deals given to backup QB Chase Daniel (SE = 5) and backup IOL Oday Aboushi (SE = 4). This leads to the Lions having a generally positive offseason thus far, but not overly impressive in terms of the model. In terms of their signings’ impact on the field, however, our very own Tej Seth loves their moves.
10. New Orleans Saints (ASE = 0.62)
The only cases where the Saints failed in the eyes of the model, similar to the Bears, is in the CB market. The Saints signed starter Janoris Jenkins, backup Patrick Robinson, and backup Justin Hardee and had a net SE of -11. In nearly the rest of their signings, however, they had a positive SE. Most notably, backup QB Taysom Hill (SE = 5), backup LB Kiko Alonso (SE = 4), backup DL Noah Spence (SE = 4), and backup S JT Gray (SE = 4) were all graded out very positively according to the ASE model. Even their projected highest impact signings, Pro Bowl S Malcolm Jenkins (SE = 1) and starting WR Emmanuel Sanders (SE = 2) graded out positively.
T9. Tampa Bay Buccaneers (ASE = 0.64)
The Buccaneers made the move which will define this offseason in signing GOAT QB Tom Brady and invested the most resources into that signing. The ASE model agrees with this move yielding an SE of 0. The same could not be said of their moves in the trenches. Franchise tagging All-Pro DL Shaquil Barrett and signing starting DL Jason Pierre-Paul, starting DL Ndamukong Suh, backup IOL Joe Haeg, and backup DL Rakeem Nunez-Roches netting an SE of -15. The Bucs gamed the system, however, by offsetting these moves in the eyes of the ASE model by signing backup TE Tanner Hudson and backup WR Bryant Mitchell to incredibly cheap contracts and a net SE of 17.
T9. Jacksonville Jaguars (ASE = 0.64)
The Jaguars analysis was done assuming that starting DL Yannick Ngakoue will not be a Jaguar by the beginning of next season. Only one of the Jaguars moves were considered egregiously inefficient, and that was the deal given to starting CB Darqueze Dennard with an SE of -5. The rest of their inefficient moves were either -1 or -2 SE, which is not too big of a deal. The Jaguars did take some advantage of the WR and TE market by signing backup WR Keelan Cole and starting TE Tyler Eifert to efficient deals, but that is not where the bulk of their efficiency lies. The bulk of their efficiency lies in their defensive front seven where backup LBs Lerentee McCray and Austin Calitro as well as backup DL Brian Price were given efficient deals with a net SE of 15.
7. Denver Broncos (ASE = 0.65)
The Broncos are similar to the Bucs where the ASE model did not appreciate their biggest moves of the offseason but loved their signings of backups at skill positions. Their 6 most expensive moves (trading for Pro Bowl DL Jurrell Casey and starting CB AJ Bouye and signing All-Pro Safety Justin Simmons, starting IOL Graham Glasgow, Pro Bowl RB Melvin Gordon, and backup CB Bryce Callahan) graded out to a whopping net SE of -41. Those signings for the Broncos were essentially the only negative SE deals they had. The signings of backup WRs Diontae Spencer and Tim Patrick, backup QB Jeff Driskel, and backup OT Jake Rodgers alone netted the Broncos an SE of 42. This is a prime example where ASE is not necessarily indicative of a team making appropriate moves. Their high ranking would suggest they made lots of good moves where in reality they just signed a bunch of backups to small deals which is incredibly efficient.
6. Atlanta Falcons (ASE = 0.67)
The Falcons biggest sins with respect to ASE, they overpaid RBs. Starting RB Todd Gurley and backup RB Brian Hill amounted to a net SE of -14, which is by far the plurality of their negative SE signings. The only other bad SE signings they had were starting DL Dante Fowler Jr and backup CB Blidi Wreh-Wilson, but their net SE was only -5 which is less than Brian Hill’s single SE of -6. The dirty birds acted very efficiently in re-signing starting DL Tyeler Davidson, acquiring starting TE Hayden Hurst, and securing a cheap contract for backup WR Laquon Treadwell. Although there is not much in terms of separating the Broncos and Falcons in terms of ASE, the Falcons have definitely acted much more efficiently this offseason.
5. Baltimore Ravens (ASE = 0.73)
Michael Brockers’s contract falling may have a negative affect the Ravens run defense next season (although there is evidence that may be easy to replicate), but it dramatically helped their ASE. When factoring him in as a starting DL at $8 million AAV, the Ravens’ ASE drops down to 0.5, putting them down equal with the Raiders and Rams. With what they actually did, ASE did not appreciate their heavy investments into defense, but primarily it punished the signing of backup CB Jimmy Smith with an SE of -6. If he ends up starting, then his SE is still -5, but the Ravens’ ASE goes to 0.82. The model particularly liked the deals awarded to backup OT Andre Smith and backup WR De’Anthony Thomas. The Ravens were also one of the few teams to sign a RB and not overpay him, as backup RB Gus Edwards was awarded the cheapest contract of the Ravens offseason thus far, which gave him an SE of 0.
4. Carolina Panthers (ASE = 0.85)
The Panthers essentially followed the same model as the Ravens. Very few of their contracts were considered negative, and only the one which was significantly negative was a backup CB. Only for the Panthers that backup CB was Juston Burris, who also got a SE of -6. The ASE model agrees with the biggest moves of the Panthers’ offseason with starting QB Teddy Bridgewater and starting WR Robby Anderson having SE of 0. As alluded to earlier in the Chargers’ breakdown, starting OT Russell Okung yielded a SE of 5 in the Trai Turner trade. The Panthers most efficient move, according to the ASE model, was signing backup WR Pharoh Cooper to a cheap deal with a SE of 7. This was the Panther’s only case of abusing signing cheap backup WR/TE/QBs for high SE though. The majority of their ASE comes from efficient deals given out to starting LB Tahir Whitehead and a litany of other backup defenders.
3. Washington Redskins (ASE = 0.93)
The Redskins offseason to date has followed the Broncos offseason to a frightening degree. Their 5 biggest moves (franchise tagging Pro Bowl IOL Brandon Scherff and signing starting CB Kendall Fuller, starting IOL Wes Schweitzer, and backup S Sean Davis) yielded a net SE of -30. They too offset this by getting cheap backup TEs in Richard Rodgers, Marcus Baugh, and Logan Thomas as well as a cheap backup QB in Kyle Allen. In total they yielded a net SE of 38. If just Sean Davis becomes a starter the Redskins’ ASE rises to 1, if just Logan Thomas becomes a starter the ASE becomes 0.73, and if both become starters then it becomes 0.8. What separates the Redskins and Broncos, however, is that they also capitalized on efficient contracts at other positions. For example, they signed starting OT Cornelius Lucas (assuming the Trent Williams saga ends with him out of Washington), starting LB Jon Bostic, and backup DL Caleb Brantley to very efficient contracts.
2. Miami Dolphins (ASE = 0.94)
The Dolphins and Redskins follow an extremely similar model, just the Dolphins take much better advantage of signing non-skill position players to efficient contracts. Their 7 biggest contracts given out so far were considered inefficient, but 4 of them were particularly inefficient. All-Pro CB Byron Jones, starting IOL Ereck Flowers, backup DL Emmanuel Ogbah, and starting HB Jordan Howard combined for a net SE of -24. This is not nearly the most egregious group of contracts of an NFL team, but it is still notable. The Byron Jones contract may ruffle the feathers of some fans, but it is labelled as inefficient due to the fact that CBs have a much lower pWAR than anticipated according to the paper cited for this analysis. The most efficient contracts were unsurprisingly named as the ones given to backup WRs Isaiah Ford and Ricardo Louis, but efficient deals were also doled out across the front 7 of the defense. In particular the Dolphins took great advantage of the LB market with starter Vince Biegel and backup Elandon Roberts were given incredibly efficient contracts.
1. Buffalo Bills (ASE = 1.57)
The Buffalo Bills have thus far the most efficient offseason in the NFL. Only 5 of the contracts they have awarded at time of writing were considered inefficient, with only 3 of them being particularly inefficient. Those being the ones given to starting S Jodan Poyer (SE = -5), backup DL Vernon Butler (SE = -4), and starting CB Josh Norman (SE = -4). If Josh Norman is given a backup role then his SE will go down and the Bills will only lengthen their lead over the competition. They, like many other teams, abused the market for backup TEs and WRs by signing Jason Croom and Robert Foster to cheap deals, but their real efficiencies lie in their defensive signings. Starting LB AJ Klein (SE = 4), backup LB Tyler Matakevich (SE = 6), and starting DL Star Lotulelei (SE = 2) were all signed to efficient deals. The biggest move of the Bills offseason was trading for starting WR Stefon Diggs from the Vikings for 4 draft picks. What did the ASE model think of this? Even with all of the capital invested into Diggs, the model deemed that he should have the most capital invested into him of all the Bills moves so the ASE model agreed with the move giving him a SE of 0.
Follow me on Twitter at @conormcq5
Follow us on Twitter for more great content at @mfbanalytics
