I created my first predictive model. Using an Extreme Gradient Boosting (XGBoost) Algorithm, I predicted college football win totals based on various team statistics, recruiting, and rankings data.
In this article I will describe the method and data that the model uses to make predictions, go into more detail about the model’s accuracy, and then give the model’s picks for the 2021 season.
Feature Selection
When selecting predictors I wanted to make sure that I picked out stats that accurately describe how well a team played in various facets of the game and give context to the talent on each team. Using CFBFastR and Collegefootballdata.com, I chose from a variety of categories.
Team Statistics from the Previous Season
- Offense Expected Points Added per play (EPA) – further broken down into EPA per Pass and EPA per Rush
- Defense Expected Points Added per play (EPA) – further broken down into EPA per Pass and EPA per Rush
- Offense Success Rate (SR) – further broken down into Pass/Rush SR
- Defense Success Rate (SR) – further broken down into Pass/Rush SR
- Pass Rate
- Offense Minutes Per Drive
- Defense Minutes Per Drive
- Point Differential
- ATS – Average points a team covers the spread by
EPA is a better way to measure unit performance than yards or points because it evaluates teams based on game state. For example, if an 8 yard gain is more impactful to a team’s scoring chances if it happens on a 3rd and 3 rather than a 3rd and 10.
EPA measures a team’s explosiveness and efficiency while success rate measures a team’s ability to ‘stay on schedule’ with positive plays in context of game state.
Returning Production via CollegeFootballData.com
- Total PPA from returning players
- Returning Passing PPA
- Returning Rushing PPA
- Returning Receiving PPA
- Returning Passing Usage
- Returning Rushing Usage
- Returning Receiving Usage
(PPA = CollegeFootballData’s equivalent of an EPA model)
The extreme turnover in College Football year to year makes it difficult to predict. So by including returning production and usage rates the model has more context to how a team has changed and whether they have a lot of players and specifically productive players returning.
Recruiting Data
- 247 Composite Score for each of the four previous recruiting classes
Recruiting scores gives an estimate of the talent on the team, and narrowing down by year specifically can indicate the talent of upperclassmen who will make up the majority of starters for most teams.
Rankings and Previous Success
- Wins in previous season
- Wins two seasons prior
- Final ESPN FPI in previous season
- Final ESPN FPI two seasons prior
- Final AP Poll rank in previous season
- Final AP Poll rank two seasons prior
- Preseason AP Poll ranking
Model Accuracy
The model was trained on all FBS teams from 2014-2018 with 2019 making up the testing data.
The following statistics are calculated from the test data set (2019 season).
I will explain the first three measures of accuracy towards the end of the model (I don’t want to scare away the populus with math).
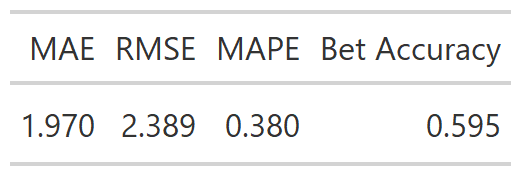
59.5% Bet Accuracy?! Watch out Vegas!
Really though, the model getting 59.5% (69 correct, 47 incorrect, 6 push) of over/under picks correct for its 2019 predictions is encouraging. While the accuracy for predicting the exact number of wins may not be where I’d like, being directionally correct in picking a side is important. However a sample of 122 bets is not enough to declare myself sharp. I constructed a 95% confidence interval for the accuracy rate of the model.
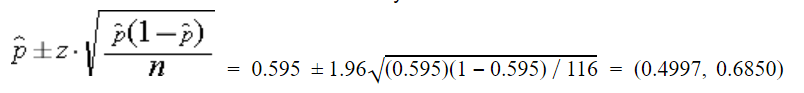
So we are 95% confident the model accuracy is between 0.4997 and 0.6850. I’m super excited to get more results after the 2021 season to see if the model continues to perform favorably.
Hopefully you have been convinced that this model does have some predictive power, now let’s dive into the 2021 predictions.
2021 Predictions
The model likes 48.7% of teams to go over their win totals for this upcoming season.
The graph below shows the difference in the distribution of wins between the results of the 2014-2019 seasons, my model’s predicted wins, and Vegas totals.
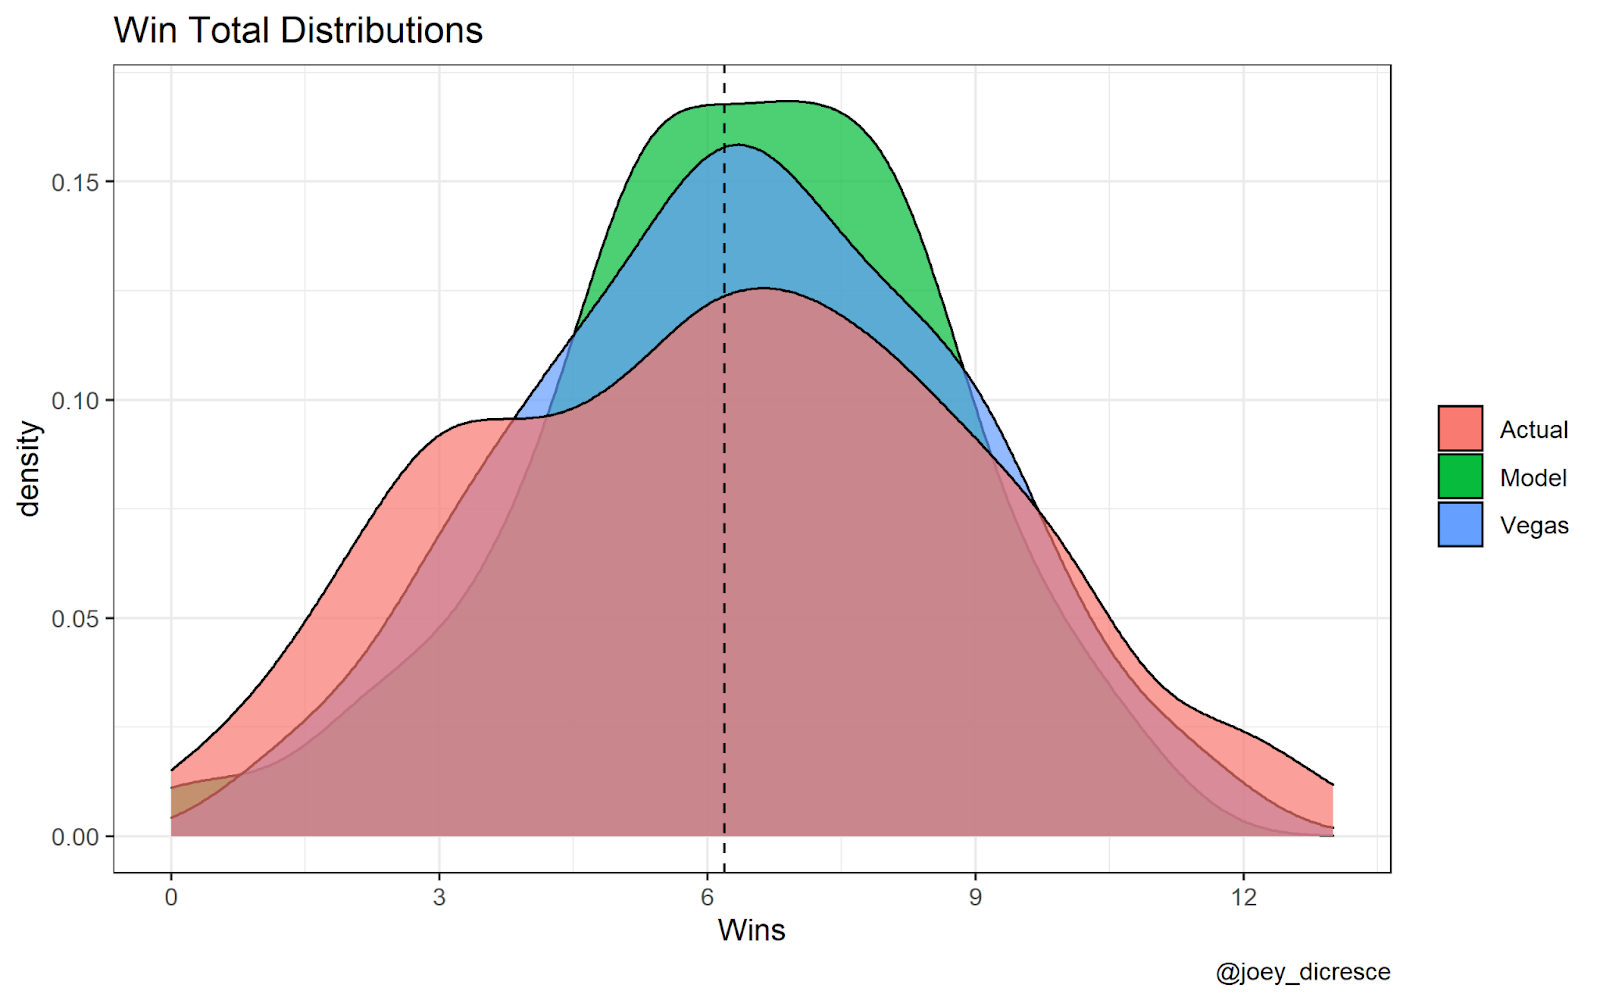
The true distribution of wins is more spread out than the model’s or Vegas. This is likely the case for a few reasons: one being that disaster and breakout seasons are difficult to predict. My model and Vegas both regress more to the center because oftentimes tail outcomes are nothing but variance or are due to unpredictable factors such as key injuries. However this does not mean that this is not a potential flaw in my model. Ideally it would be able to predict outcomes farther from the center with accuracy as well. This is something I’d like to improve if I were to revisit this model.
Best Bets
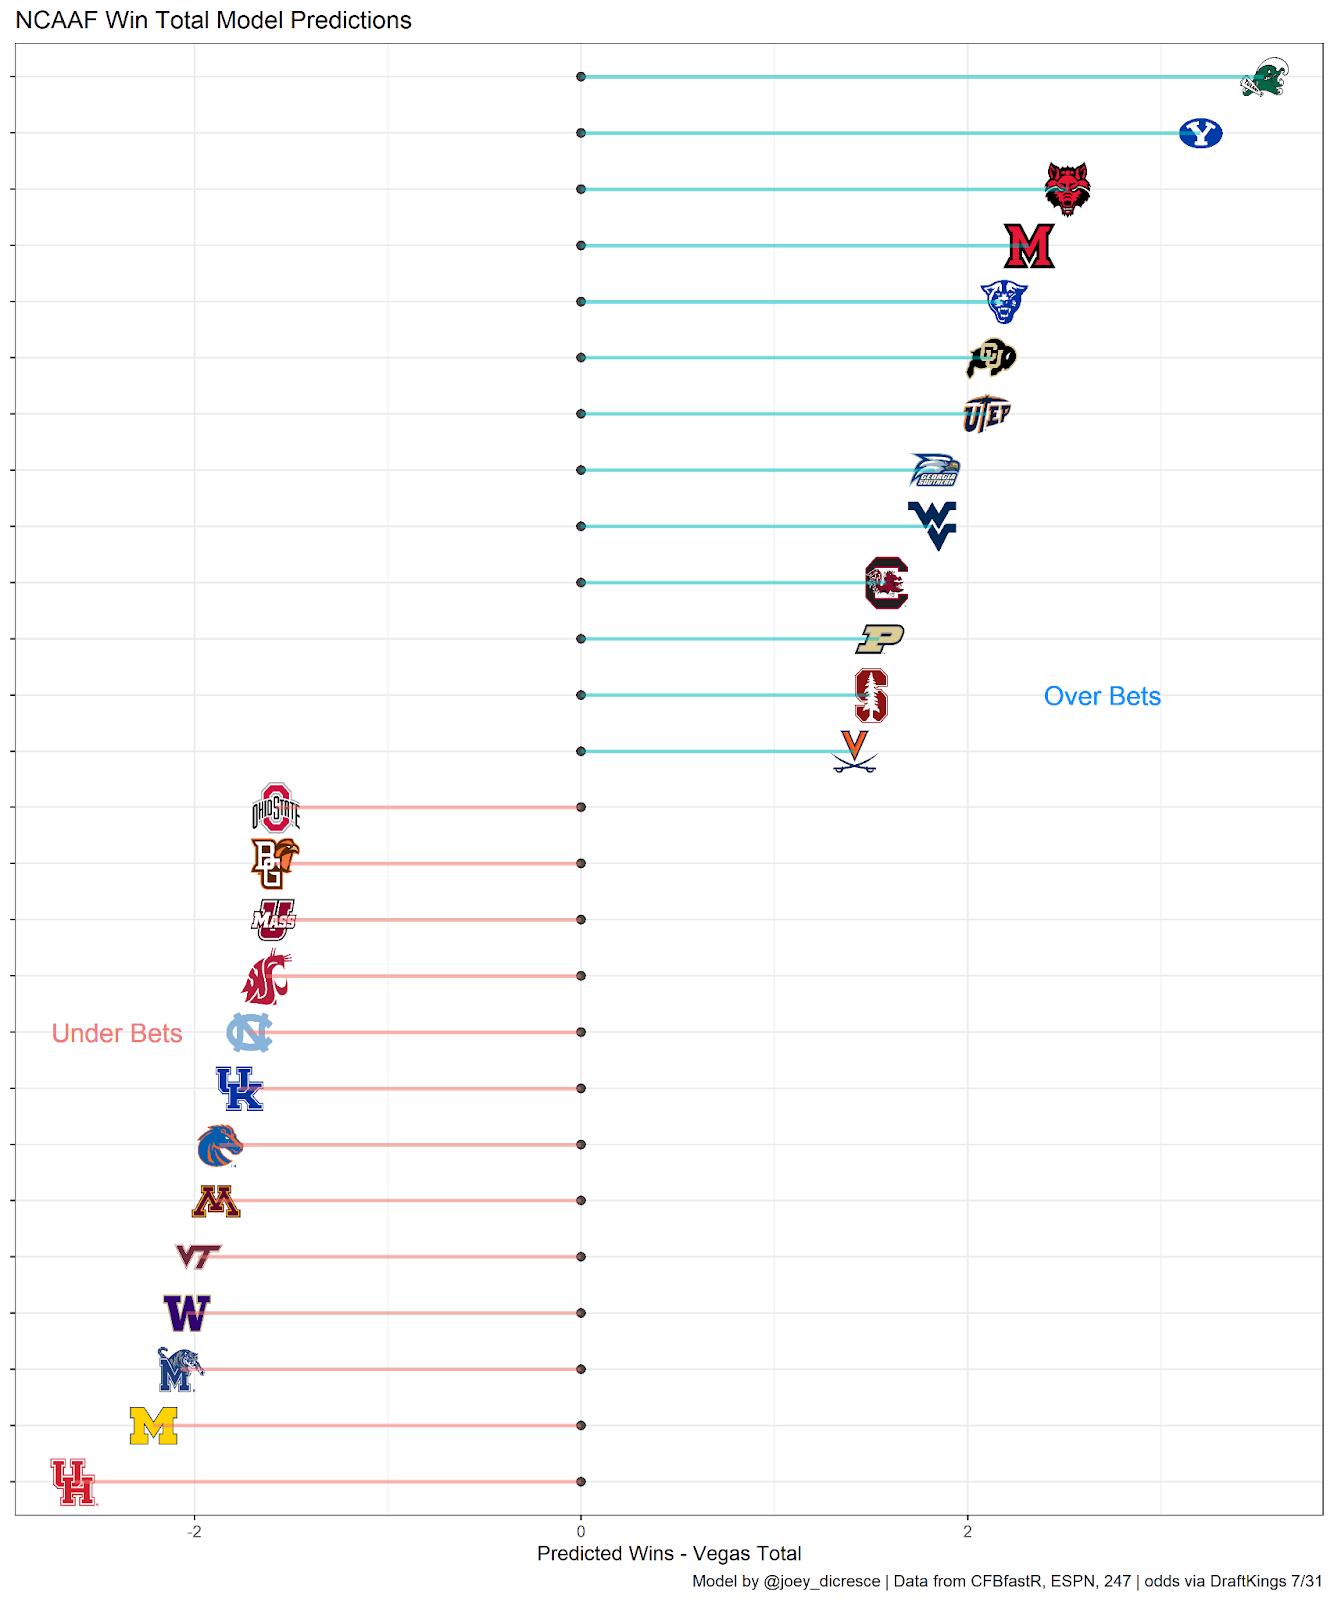
ACC
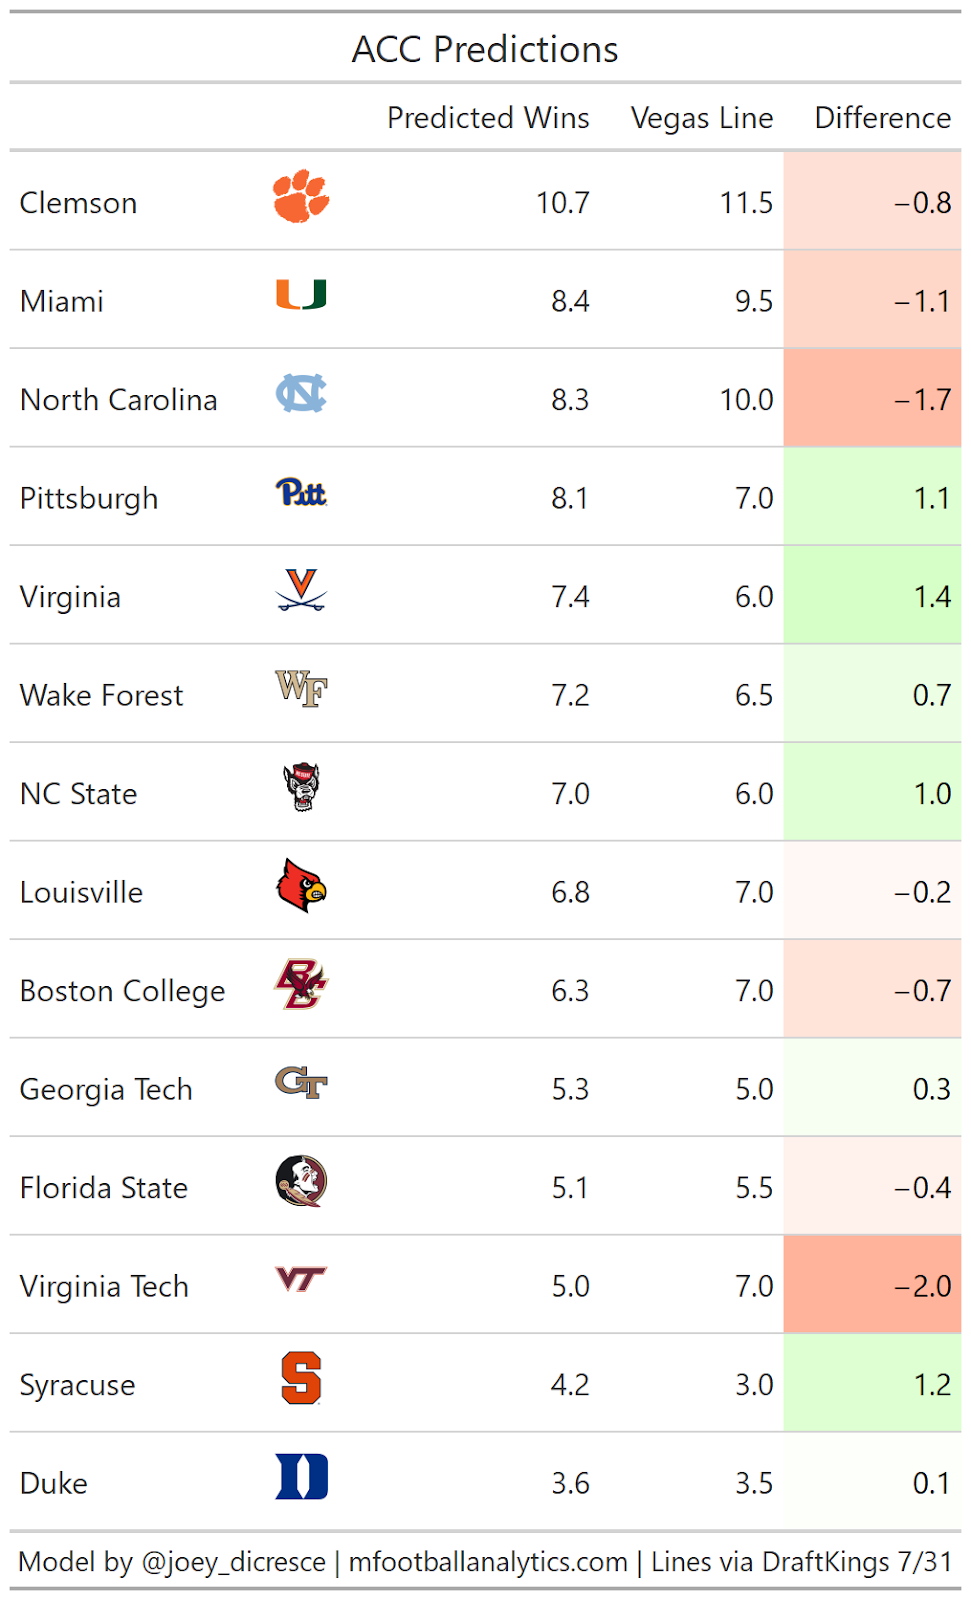
Virginia is projected to outperform it’s total, likely due to the significant amount of returning talent. Virginia returns underrated QB Brennan Armstrong, and did not lose a single RB who had any production in 2020. Virginia also returns 74% of their receiving production.
Cross town rival Virginia Tech on the other hand is one of the best under bets along with North Carolina. UNC is coming off one of it’s best seasons of the past decade led by future top 10 pick Sam Howell. However Howell will be working with a lot of new faces at skill positions after losing impact players like Dyami Brown, Javonte Williams, and Michael Carter.
Big Ten
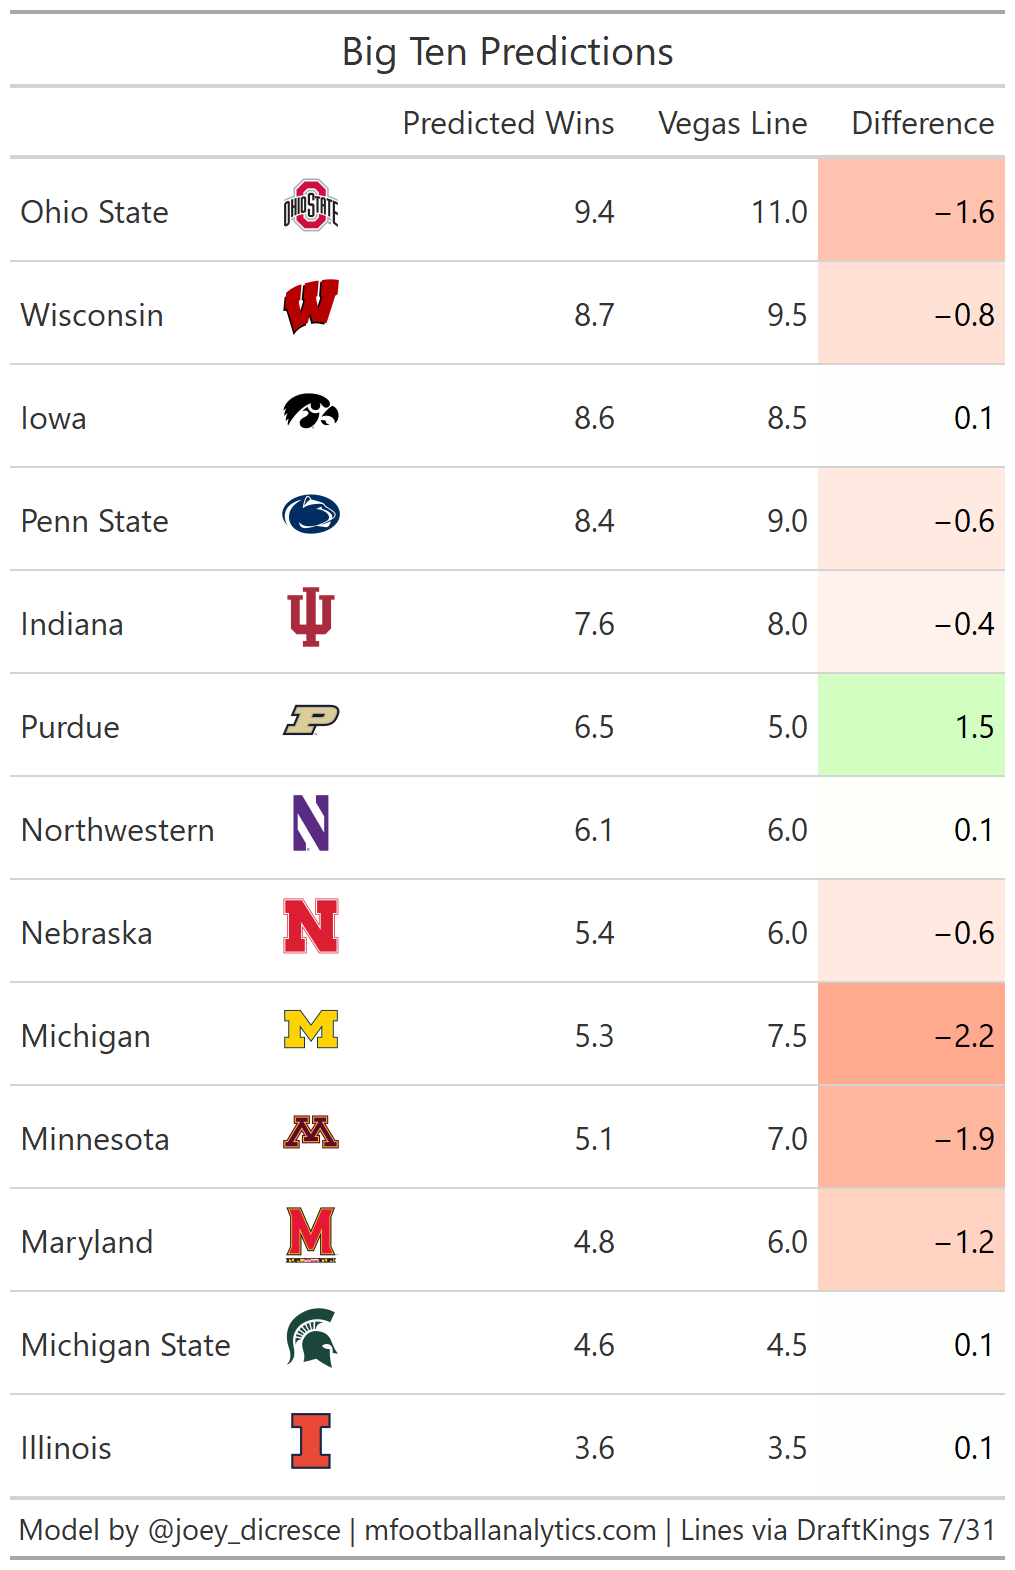
The model is down on a lot of Big Ten teams, unfortunately including my Wolverines. I think the OSU total will be very interesting to monitor. OSU’s offensive production with Justin Fields was outstanding. OSU was top 15 in pass EPA and success rate in 2020. Losing all that production is a tall task for any program. So even though OSU will be replacing Fields with a former 4 or 5 star recruit in C.J. Stroud, Kyle McCord, Jack Miller, or maybe even Quinn Ewers, the model does not expect OSU to go over their total of 11.
Big 12
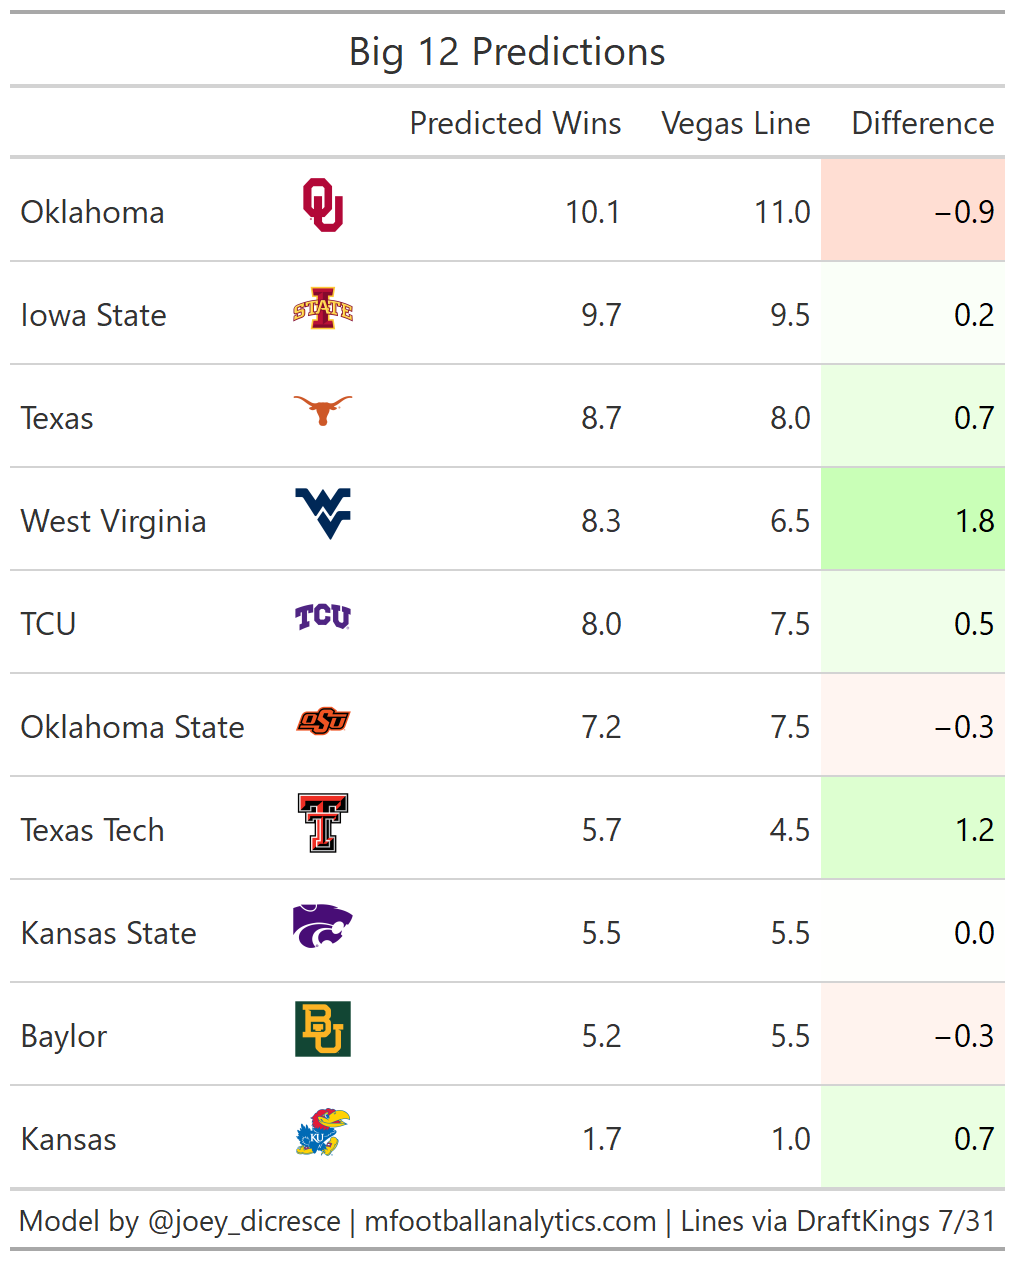
Texas is one of my favorite bets from this group. Texas had top 10 recruiting classes every year from 2018-2020, so the team should have more talent than all but maybe Oklahoma in the conference. I’m also a big believer in Steve Sarkisian. I think he will lead a much improved Texas Offense to go over their total of 8.
SEC
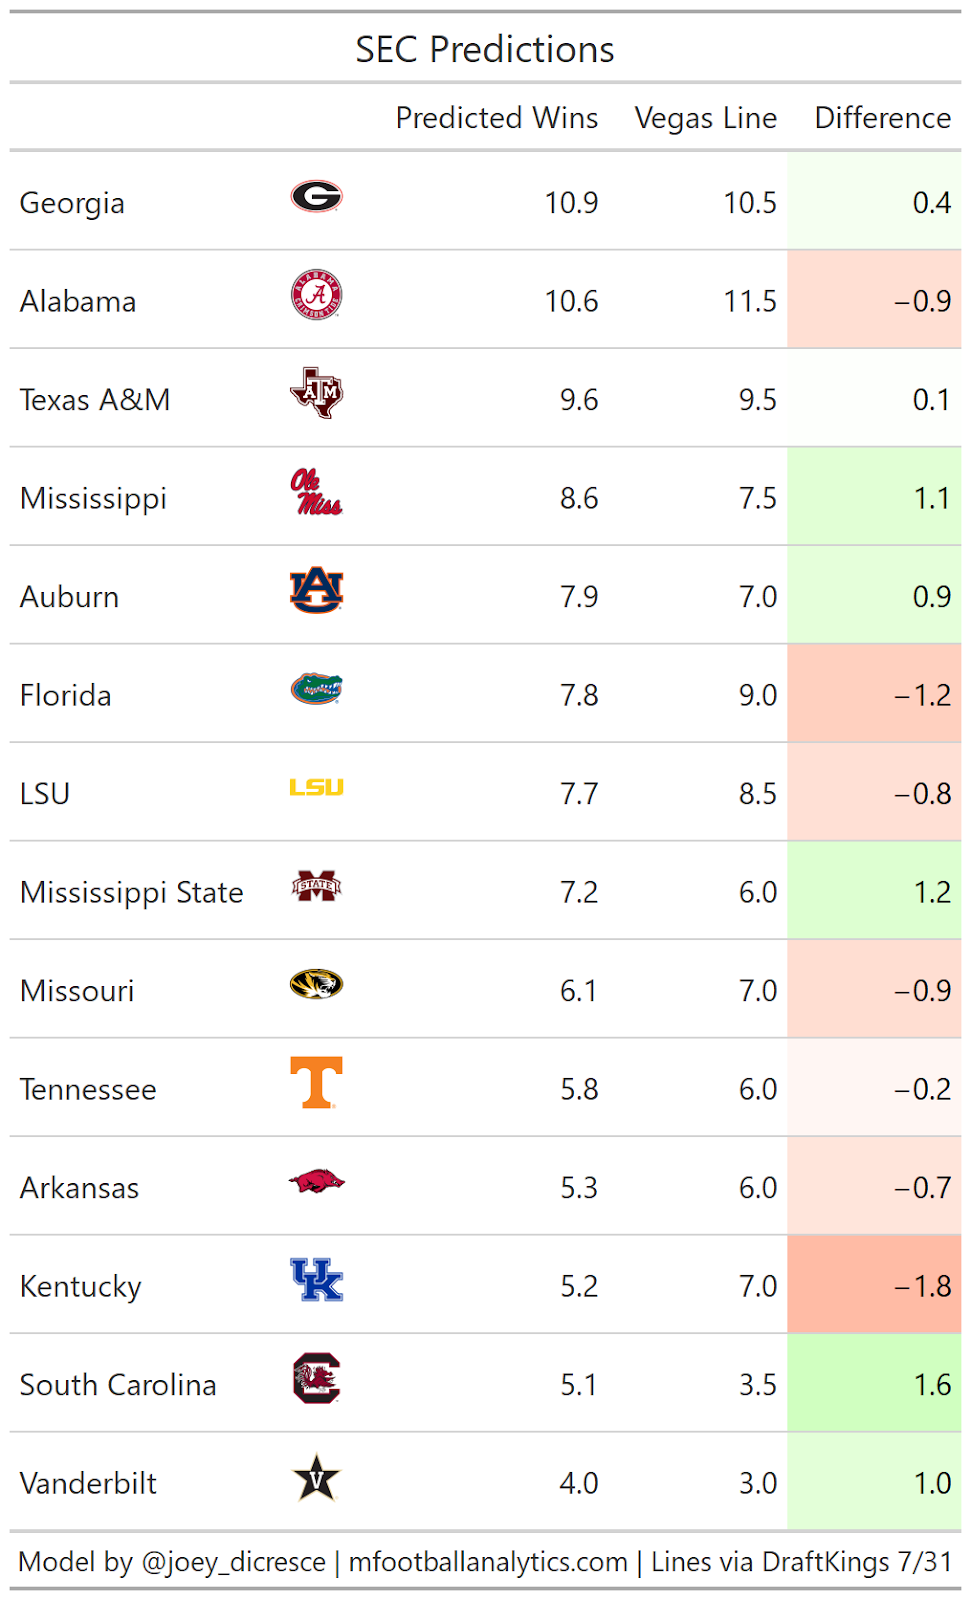
Georgia over Alabama shocks me, although looking at the data it may be warranted. Georgia has the best average recruiting class rank over the past 4 years in all of FBS with classes ranking 3, 1, 2, and 1. Also even though Bama is replacing their production with more top tier recruits, Georgia returning more players gives a little more certainty in their offense heading into the season. Georgia is returning over 90% of their usage for passing, rushing, and receiving while Bama returns 7%, 37%, and 35% respectively.
PAC 12
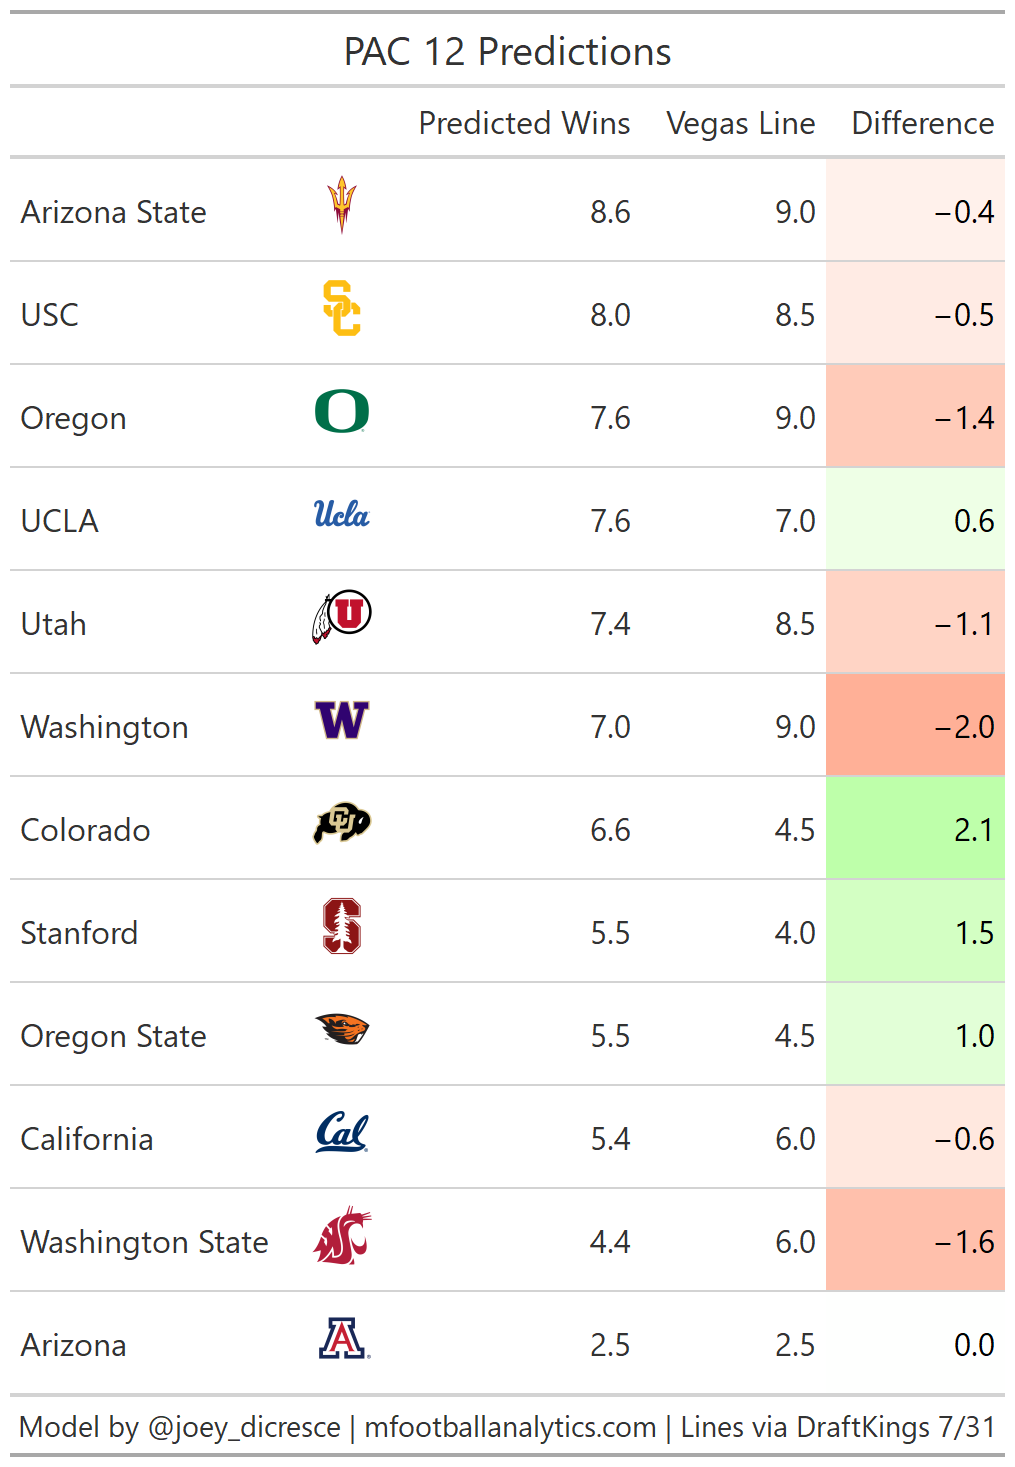
The model confirms my prior that UCLA over is a good bet. I’m a big believer in UCLA’s QB and Head Coach combo of Dorian Thompson-Robinson and Chip Kelly. Also, Colorado has an extremely underrated defense. Last season Colorado’s defense was 2nd in the PAC 12 in EPA and SR, only allowing a successful play on 36% of snaps.
Group 5 and Independents
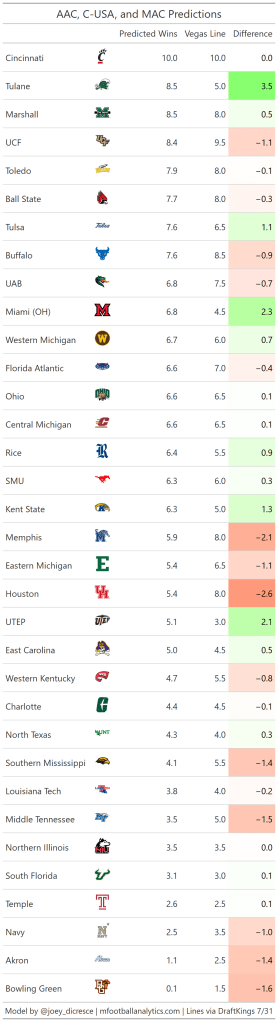
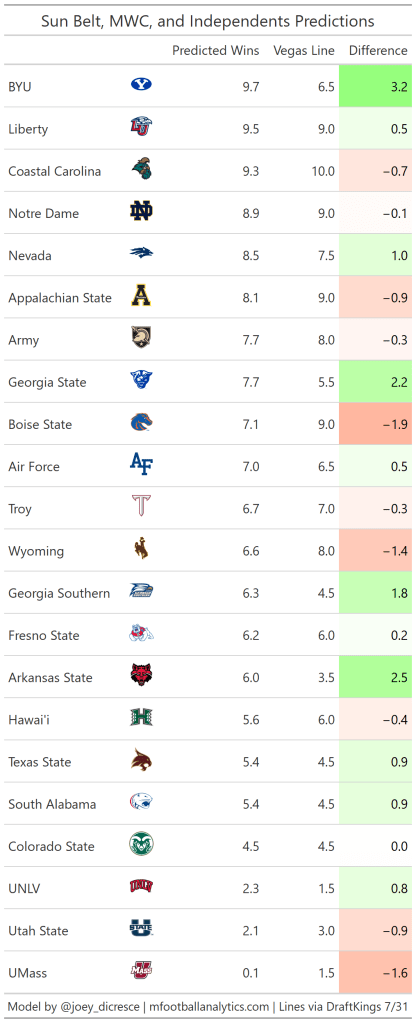
The model sees value in a lot of Group 5 teams. The team with the largest difference between projected wins and Vegas line is Tulane. My model project Tulane to win 8.5 games while their total is only set at 5. Tulane’s offense was great in 2020, leading the AAC in EPA and success rate. Tulane’s offense is well balanced, but their run game in particular is excellent. In 2020 Tulane’s EPA per rush of 0.178 was good for 5th out of all FBS teams.
More Math – The Other Three Measures of the Model’s Accuracy
A MAE or mean absolute error of 1.970 means that on average the model’s prediction was off by 1.970 wins in either direction. The RMSE or Root Mean Squared Error again takes the absolute error, then squares it. Then the square root of the sum of these values is the RMSE. The RMSE is similar to MAE but it punishes more harshly for larger errors. The RMSE is important for evaluating the accuracy of the model, but would be more useful if we could compare it to other models. Unfortunately the best statisticians in the sports betting world aren’t known to share their work. Finally the MAPE (Mean Absolute Percentage Error) is more important in cases where the MAE or RMSE get so large that it is difficult to take significant meaning from them. MAPE gives more context because each error is calculated as a percent of the actual value. So the MAPE of 0.380 means that on average the absolute value of the error will be 38% of its actual win total. A MAPE of over 30% is fairly large, in the future I hope to fine tune my model and improve its accuracy.
Final note on the model methodology and conclusion
I want to note that I think a better way to build a model to predict win totals would be to calculate and use win probabilities for each game in a team’s schedule. However this would require techniques I am not familiar enough with.
Thanks for reading! Building this model was definitely a great learning experience. Feel free to reach out to me on twitter @joey_dicresce and as always thanks to the team at CFBfastR and CollegeFootballData.com for making work like this possible with their extensive publicly available data and resources.
