The NFL’s 2nd Annual Big Data Bowl was amazing in a lot of ways. The NFL released tracking data that takes a snapshot of each player on the field every tenth of a second during a play. Using that tracking data, contestants were given the task of predicting how many rushing yards a play would go for. Data scientists Philipp Singer and Dmitry Gordeev from Austria captured the top prize of $50,000 with their highly technical approach. The surprise: They had never watched a game of football in their life. You might have seen their work on Twitter for example this play where Chris Carson goes for +24 yards over expected and Pete Carroll yells “THIS IS WHY WE RUN THE BALL”: Chris Carson.
There are so many public resources out there for NFL data with the golden standard being nflfastR. However, the NFL’s Next Gen Stats department doesn’t provide play-by-play information for each expected rushing yards and yards over expected. This limits a lot of things people can do with the data as the NFL only provides a couple statistics about a player and users can’t look at those statistics through filters such as garbage time and certain downs. Despite being a 19 year-old college student with no tracking data but 2 days of free time before classes started (the exact opposite of a Austrian data scientist), I set out to create my own expected rushing yards model using just the features publicly given to me. Those features are listed below:
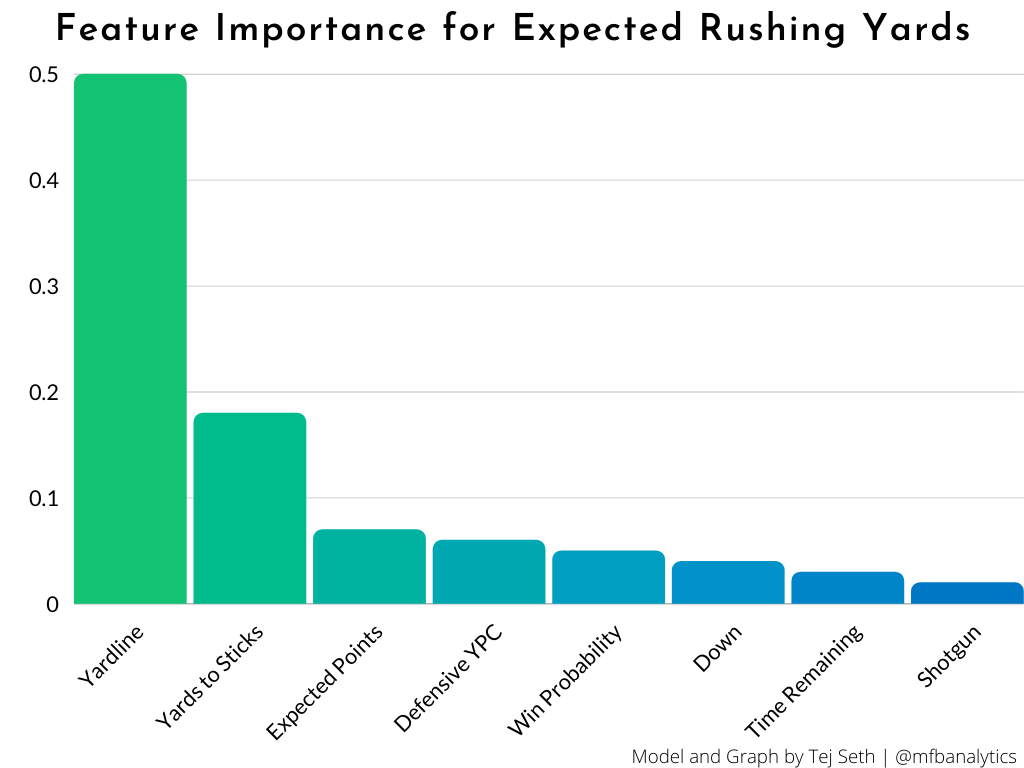
With the help from my friends Micahel Egle (@deceptivespeed_), Conor McAnalytics (@ConorMcQ5) and Sean Sullivan (@papamoon92), I created an xgboost machine learning algorithm that takes the features above and turns it into expected rushing yards for each NFL play in the 2020 season. By using my code below, a user can now get the expected rushing yards for any play during the season and find out who their team’s best rusher is in certain situations.
The public code: https://gist.github.com/tejseth/50ef14c04e9a3663045701171310592c
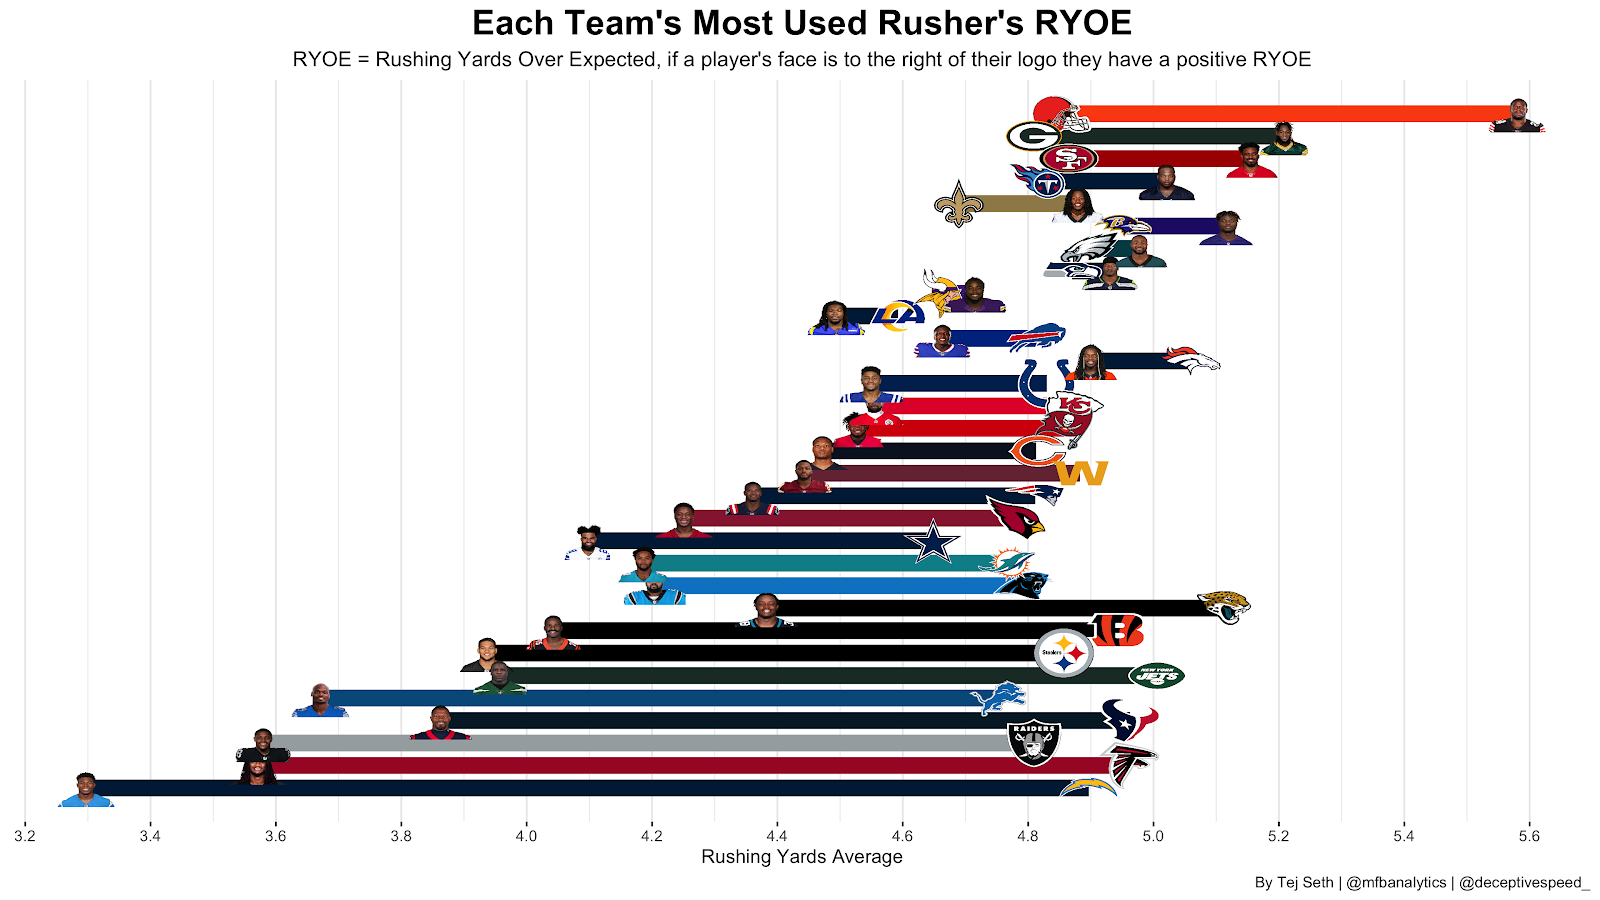
Before you see who the number 1 rusher in the NFL is, just know that these are all designed runs and scrambles were not included. Without further ado, here are all the rusher’s rushing yards over expected:
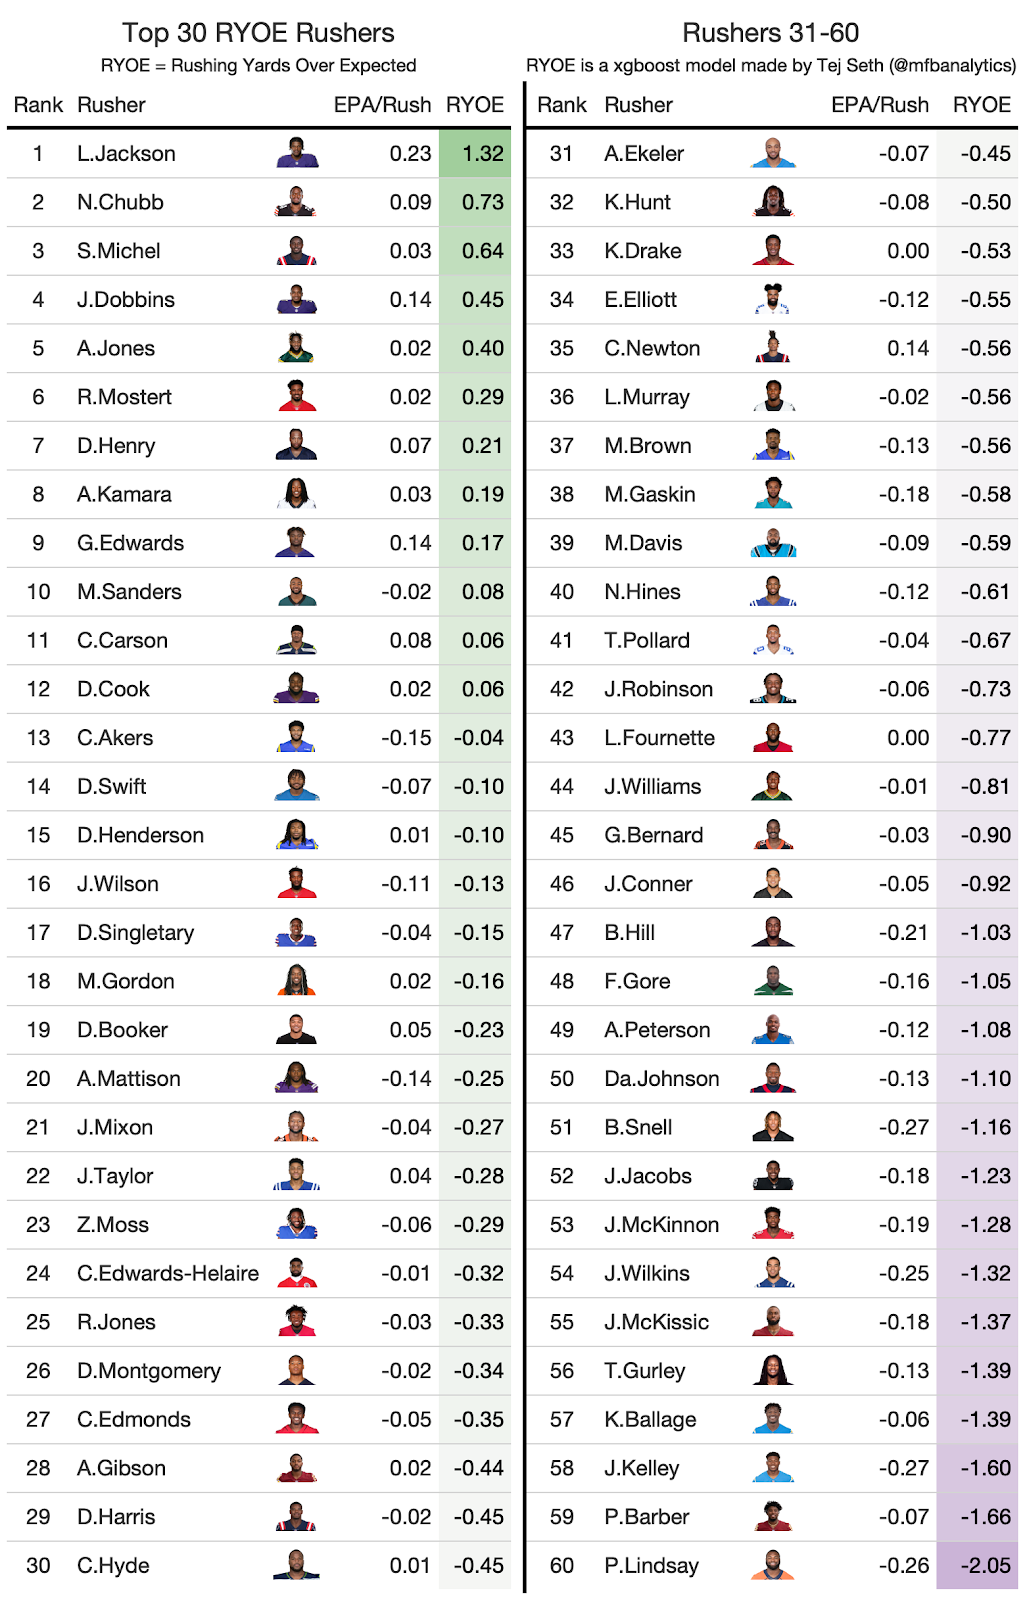
On designed runs alone, Lamar rushed for 1.31 yards over expected in 2020! Besides the Sony Michel surprise, the rest of the top 10 is more-or-less how I expected with Chubb, Jones, Mostert, Henry and Kamara all impressing with the eye test. To check out RYOE performed, let’s check it with an already established stat in EPA per rush:
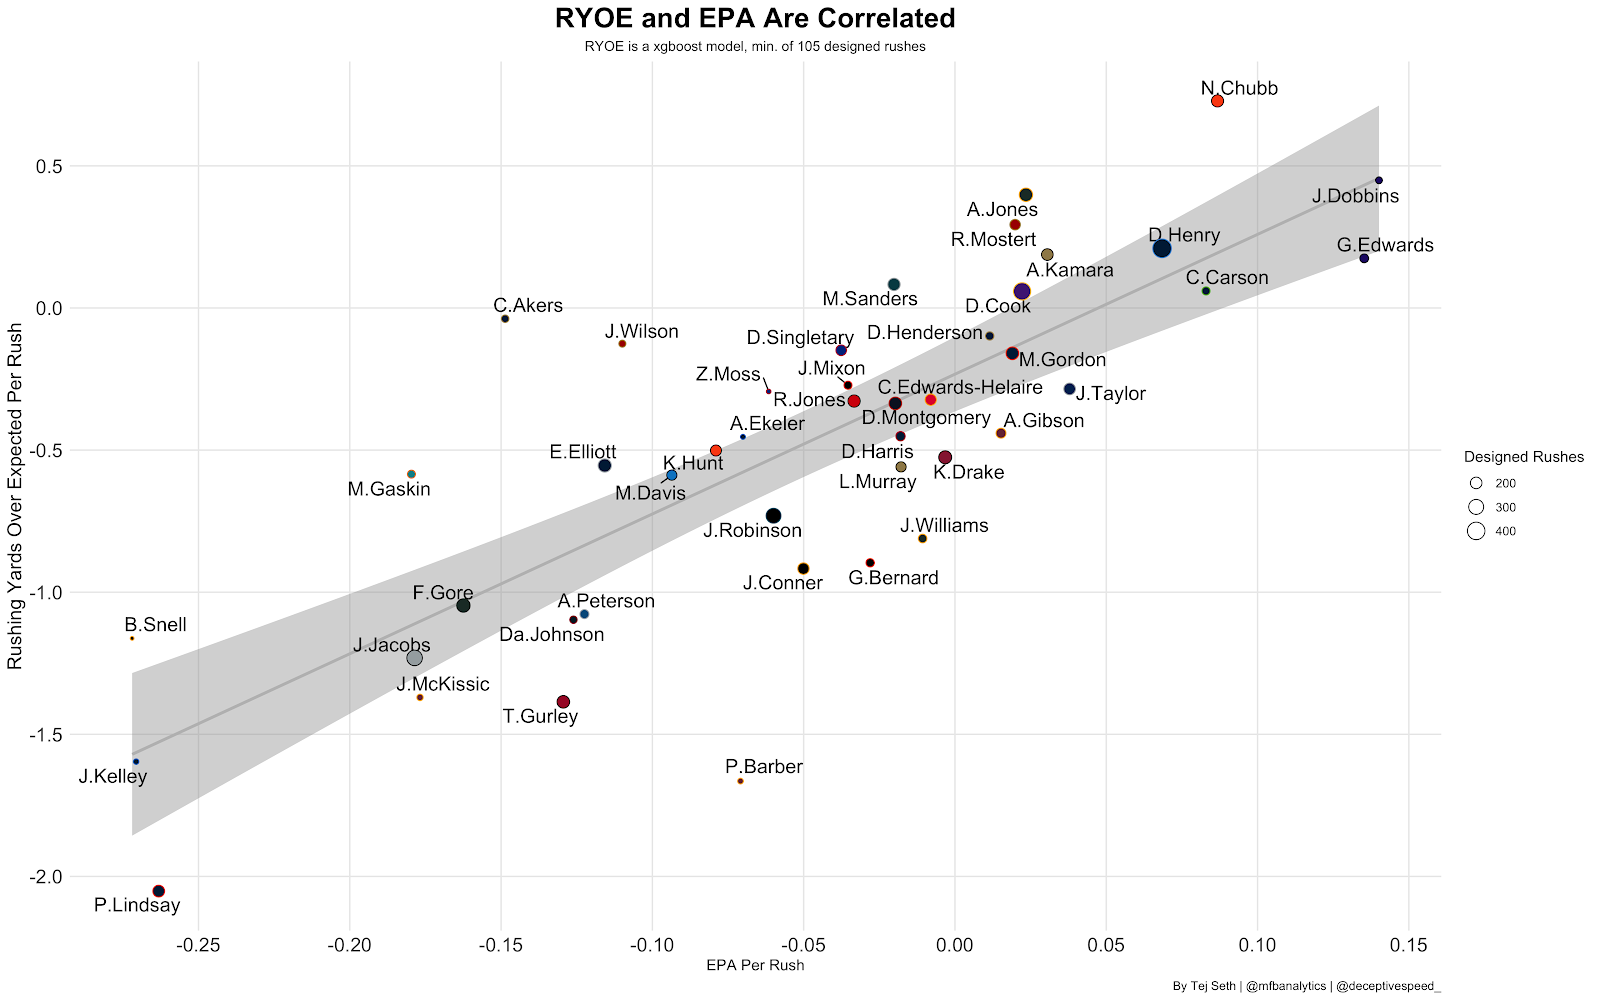
Now most of the NFL Analytics Community has a universal slogan of “Running Backs Don’t Matter.” (If the NFL Analytics Community were a part of Greek Life their slogan would be “Anyone can rush”). I won’t go as far to say that, it is clear from the data that running backs are largely dependent on their scheme and offensive line and that they can only matter in the extreme right or extreme left. Take Nick Chubb for example. He averages 5.6 yards per carry but only contributes 0.7 of that on his own accord. That means we can predict 87% of the Browns’ rushing yards without knowing who their running back is while Chubb contributes the other 13%. Joshua Kelley in the extreme left can also matter as he rushed for 1.5 yards below expectation and fumbled away their game against the Buccaneers this year. He ended up as the worst ranked running back in the NFL in 2020:
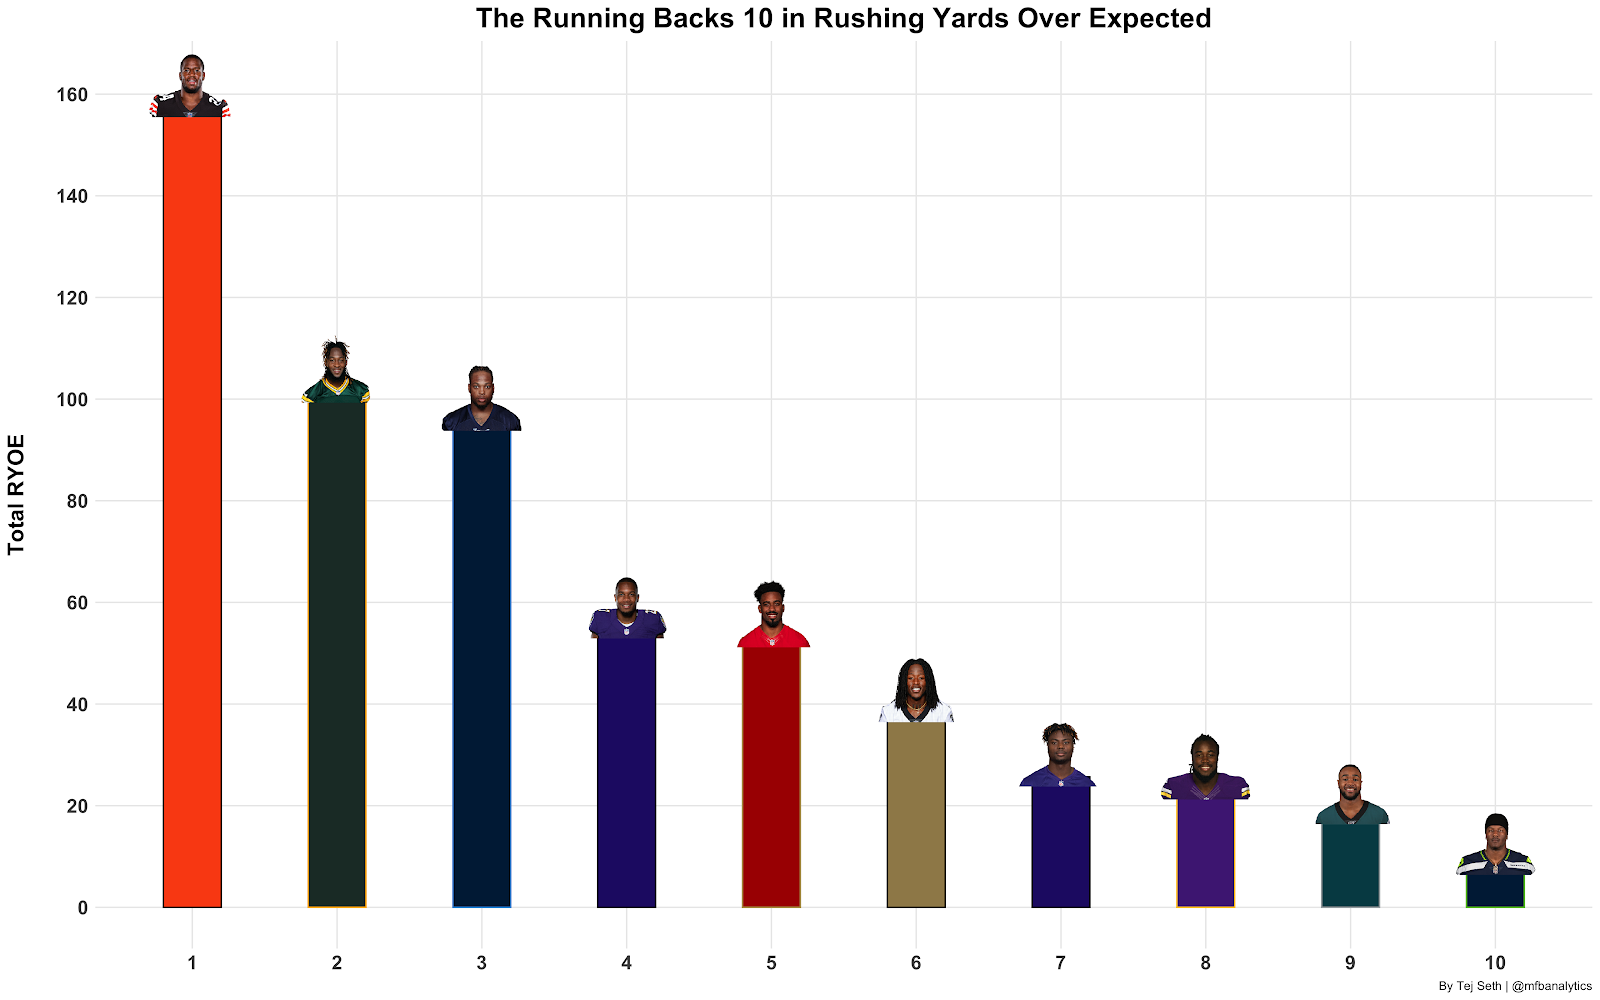
Focusing on just the positives, there were 10 running backs that had really good years in the running game!
With this model and the code being open source, I hope people will find this helpful! It’s set up in a way where it can be applied to any year of the nflfastR era (1999-2020). To those of you who know R, have fun playing around with the model and I’m excited to see if new graphs that I didn’t think of pop up on Twitter!
If you have any questions feel free to reach out to me at @mfbanalytics on Twitter or tejseth@umich.edu.
For those of you who missed it above, here is the code: https://gist.github.com/tejseth/50ef14c04e9a3663045701171310592c
