While enjoying my annual tradition of Thanksgiving leftovers and football this past weekend, I couldn’t help but notice the barrage of missed kicks. Naturally, I had to dig into the numbers. It turns out the 24 missed field goals in Week 13 tied the record for the most in a single week since 2000—the earliest year covered by the available data. A big factor? The sheer volume of attempts. This week’s 86 field goal tries set a new record, blowing past the previous high of 79 attempts from Week 2 earlier this season.

Only 72.1% (62/86) of field goals were made this week, marking the lowest conversion rate in any week since Week 1 of 2020. Remarkably, this represents the third-lowest rate in a single week since 2004. Six kickers missed multiple field goals—a feat of futility unmatched since at least 2000. Even five kickers missing multiple attempts in a single week would have been unprecedented in the modern NFL. Daniel Carlson led the charge with three misses, while Eddy Pineiro, Jake Moody, Joey Slye, Zane Gonzalez, and, of course, Justin Tucker joined him in achieving this ignominious distinction. Adding to the misery, 17 different kickers missed at least one field goal, tying Week 12 of 2001 for the most in any single week.

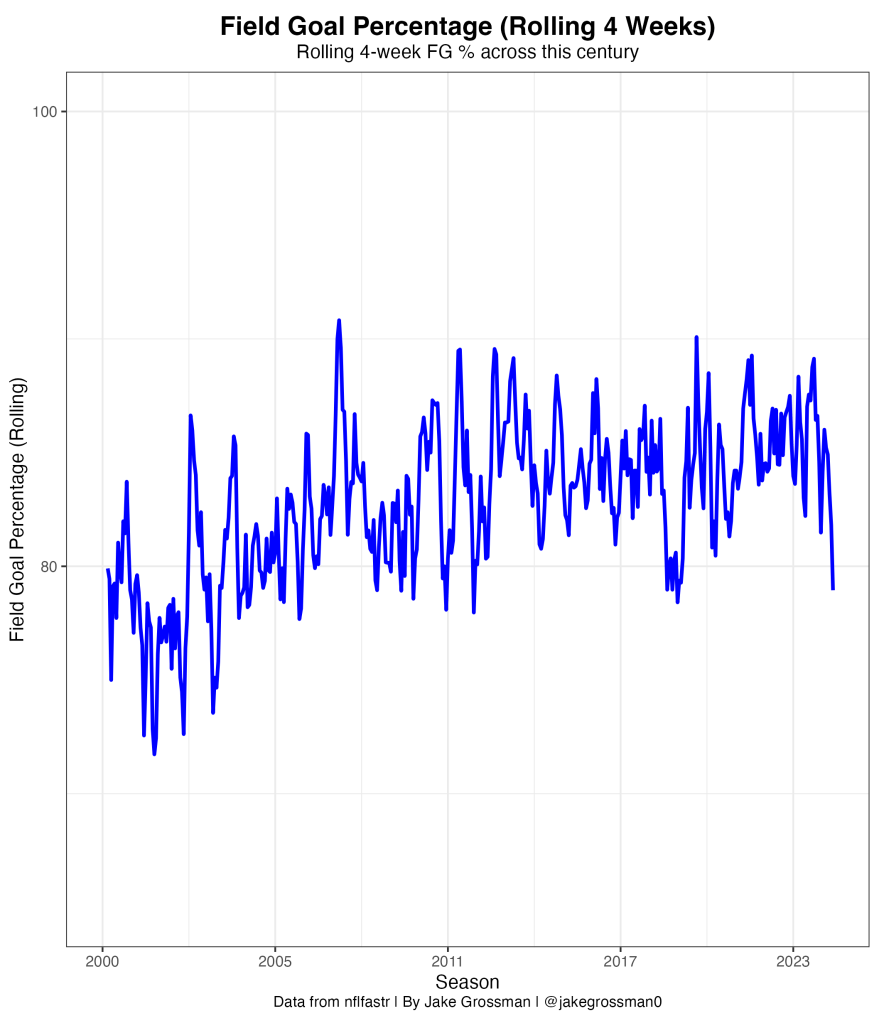
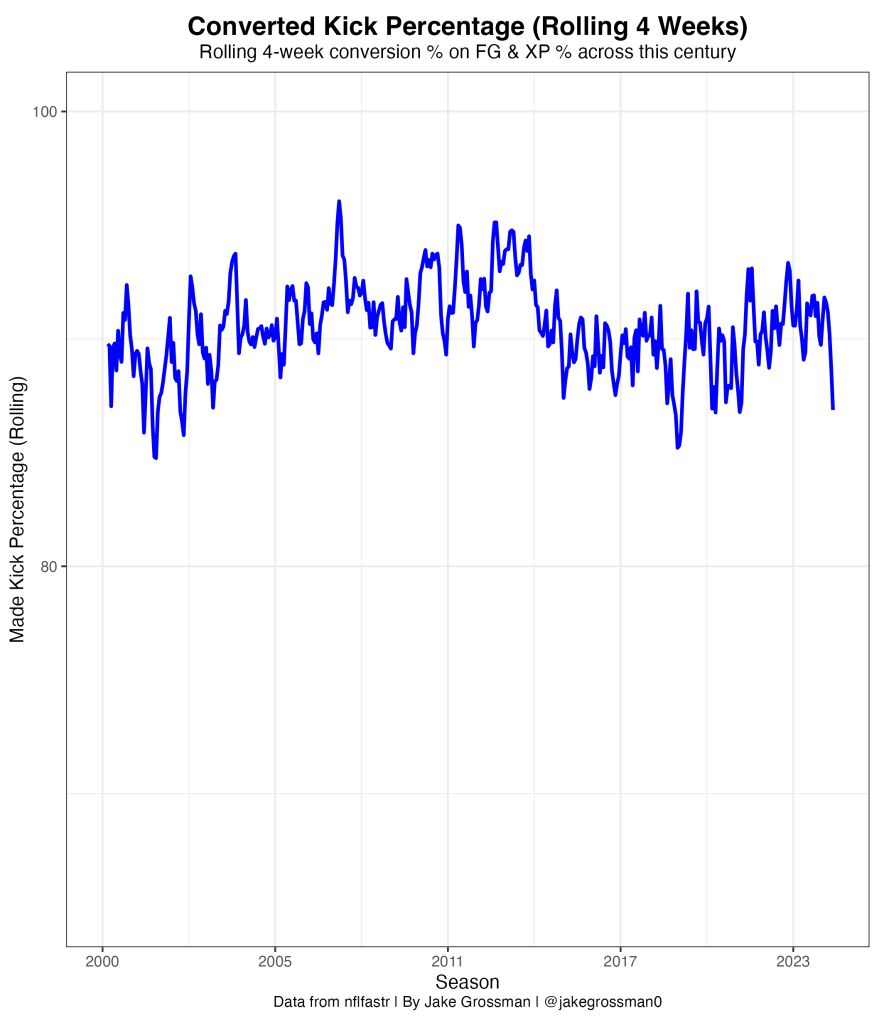
The discerning reader might ask, “This is intriguing, but shouldn’t we examine a broader sample before concluding that kicking performance is truly down this year?” That instinct is well-founded. Expanding the lens to the past four weeks reveals what could turn into a troubling pattern: this has been the most dismal stretch for field goal percentage in the past five years.
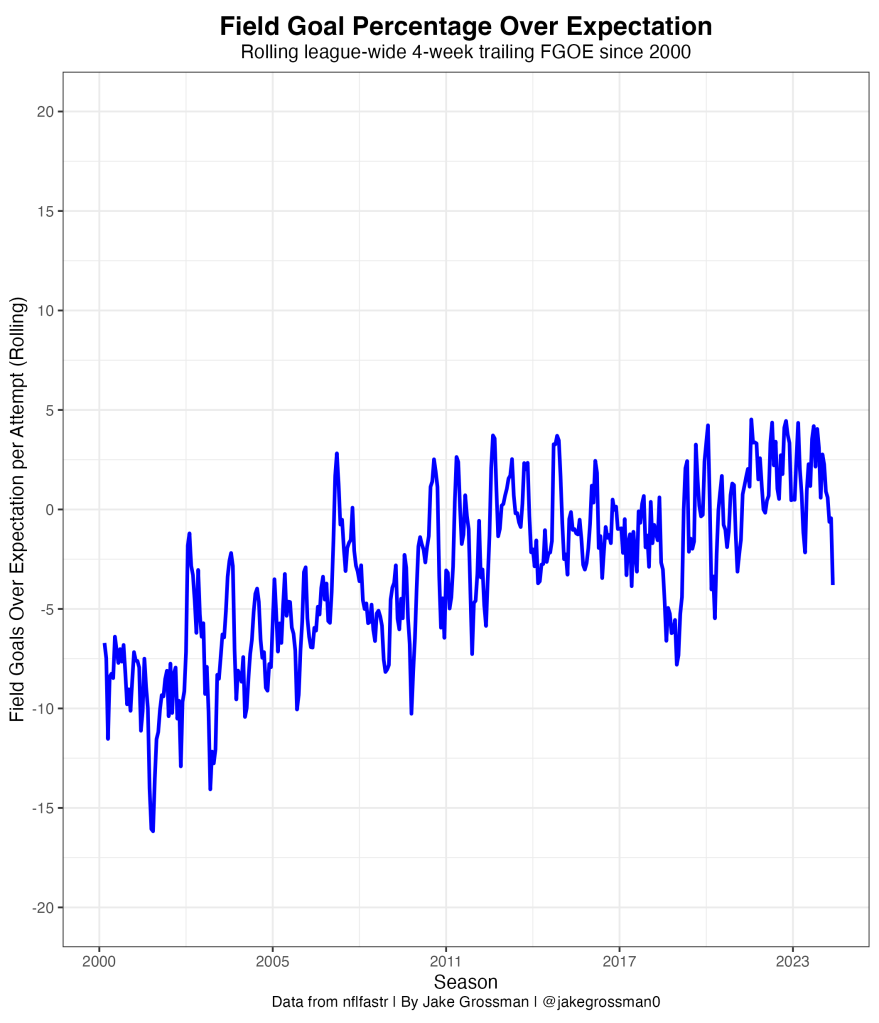
The discerning reader might then counter: “The sample size seems reasonable, but could this simply reflect selection bias—are kickers being asked to attempt more difficult kicks?” An excellent point! Field goal attempts have indeed grown more challenging over time. A closer look at expected field goal percentage since 2000 reveals a relatively steady decline, mirroring the increasing difficulty of the kicks being attempted.
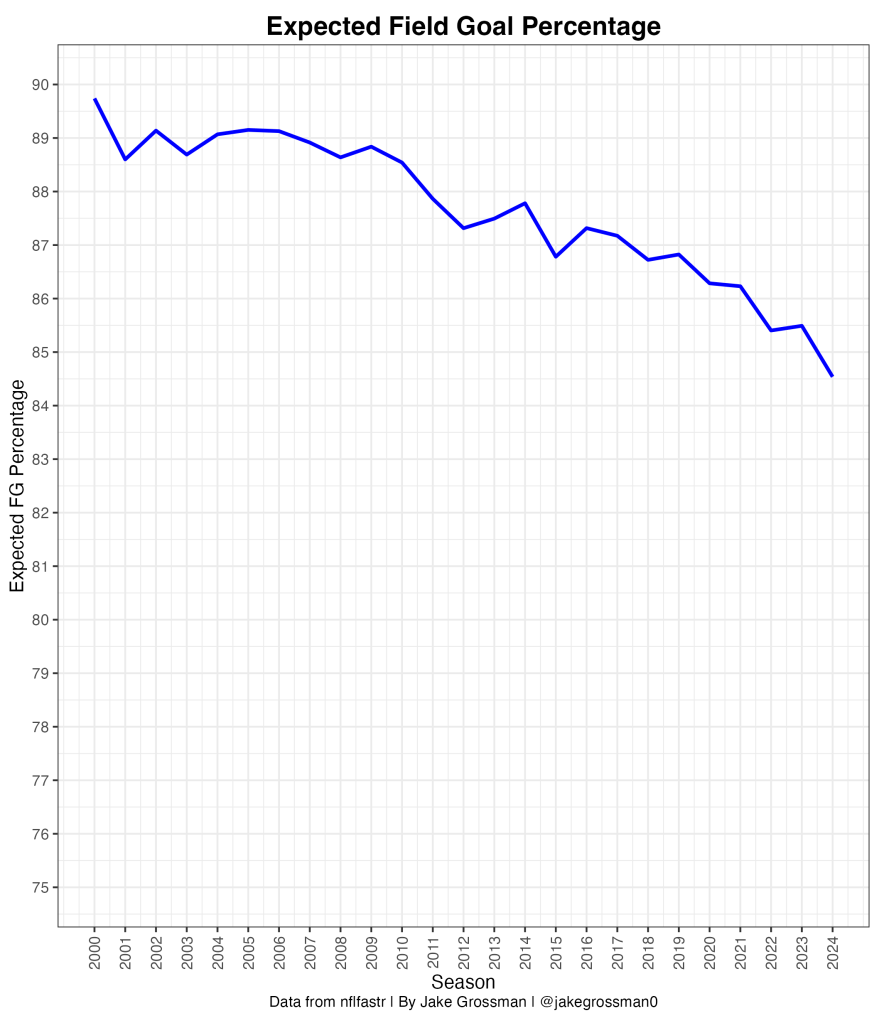
But how do we calculate expected field goal percentage? Drawing inspiration from this Open Source Football article by Mike Irene, I developed a straightforward logistic regression model to predict field goal success. This model incorporates key factors such as kick distance, wind conditions, and the presence of precipitation—variables that significantly influence a kicker’s likelihood of making a field goal. By accounting for these elements, the model provides a more nuanced understanding of the difficulty of these kicks.
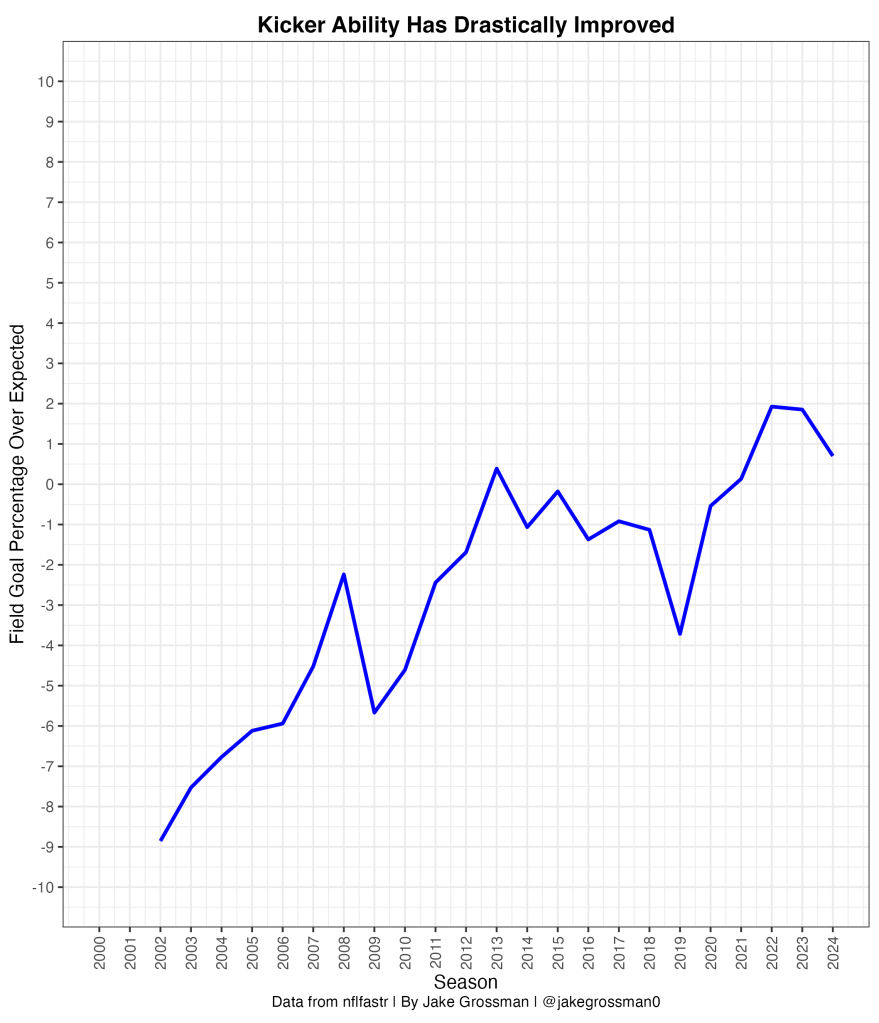
We can observe a slight dip in performance this season, but how does Week 13 stand out? Kickers in Week 13 faced an expected field goal percentage of 84.1%. This translates to a Field Goal Percentage Over Expected (FGPOE) of -11.2% once blocked kicks are accounted for. In simplest terms, this metric measures how many field goals a kicker makes compared to what we’d expect based on kick difficulty. On 86 attempts, this means nearly 10 fewer field goals were made than anticipated! While this ranks as only the 36th worst week in our dataset on a rate basis, it is notably the fourth-lowest mark since 2012.
When we shift the focus to the four-week rolling average, the FGPOE improves to -3.8%, softening the blow. Even so, Week 13 stands out as a low point for kicking in recent NFL history.
The discerning reader might now be wondering: “What about extra points? Have kickers struggled there as well?” The answer is, not particularly. As shown below, extra point conversion percentages have remained relatively stable, suggesting that the challenges faced on field goals have not extended as significantly to extra points.

When we combine the data on all kicks—field goals and extra points alike—a recent downward trend persists. While the reasons behind this remain uncertain, it will be worth monitoring in the coming weeks to see if performance reverts to the mean.
What if we break it down by distance? Kickers have largely maintained their performance on kicks under 40 yards, consistent with trends from previous seasons and their continued success on extra points. Interestingly, kickers have also maintained their steady improvement on long kicks, achieving a new peak of 71% accuracy on attempts beyond 50 yards. However, the data suggests a slight regression on kicks from 40-49 yards. This drop isn’t dramatic and it seems likely to rebound next season, as it may simply reflect statistical noise. Still, to see kickers performing almost as well from 50+ as they on 40-49 yard kicks is quite remarkable.

When we examine FGPOE across these distance ranges, the trends remain relatively consistent. From this data, it is apparent that kickers have gradually improved from all distances over time. However, this year stands out as a clear struggle on medium-range kicks, where performance has noticeably declined.

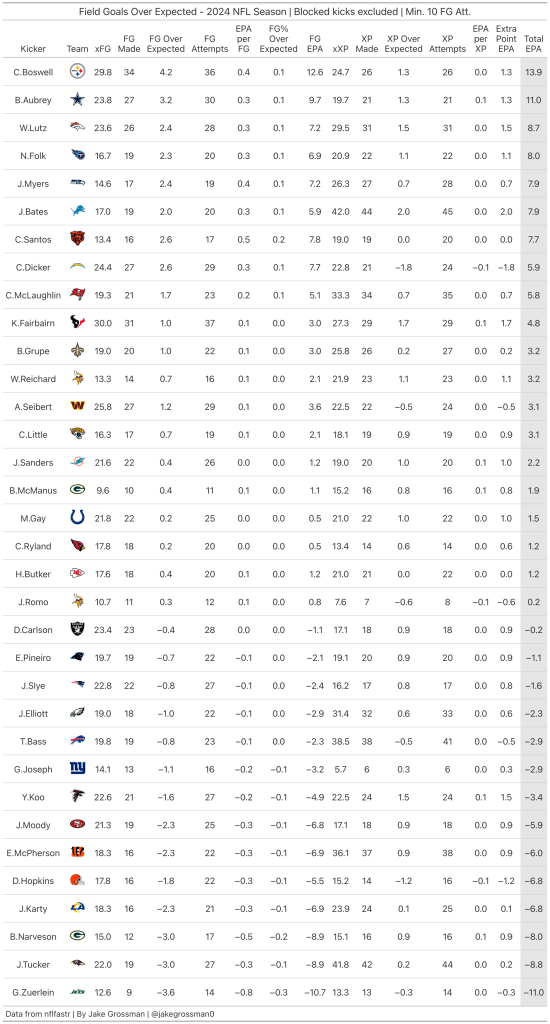
Here are this season’s leaders in Kicking EPA. To calculate this, I adapted the expected field goal model developed earlier to include extra points. The model uses the same key features—distance, wind, and precipitation—to fully quantify the value added (or lost) by each kicker. Kicking EPA is relatively straightforward to calculate. For field goals, it’s the difference between expected and actual field goals, multiplied by three. For extra points, the difference itself represents the EPA total. Combine these values, and you have the kicker’s total Kicking EPA—providing a comprehensive metric for assessing a kicker’s overall impact.
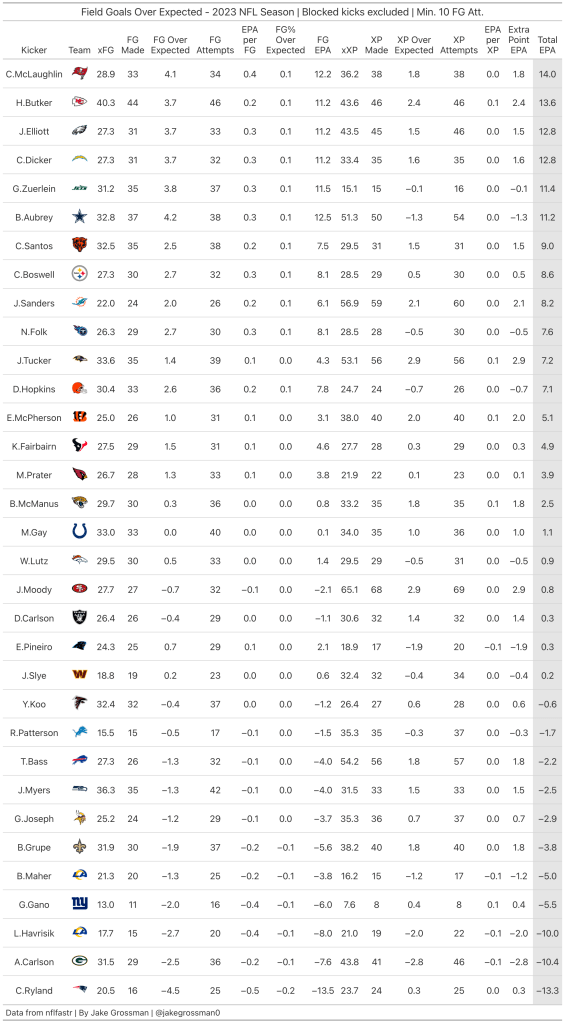
Below is a look at last year’s leaderboard. While Brandon Aubrey led all kickers in EPA on field goals, his struggles with extra point attempts dropped him to sixth overall. Notably, the data also highlights the rapid decline of Justin Tucker, Though he performed much better last season, his FGPOE has fallen by 14.7%, marking the 36th largest negative one-season swing among all kickers since 2000.
However, Tucker isn’t alone in facing a sharp decline this season. Three other kickers have experienced even steeper drops in FGPOE. Leading the pack is Greg Zuerlein, whose 35.9% decline represents the largest in the dataset. He is followed by Jake Elliott and Dustin Hopkins, who have also seen significant regressions in their performance from last season.
Finally, here are some career kicker stats for broader context. As Justin Tucker once boasted over 100 EPA for his career before this year, he still remains unrivaled as the most dominant kicker of the past 25 years. No other kicker comes close to matching his sustained excellence and impact over such a long period. Greatness does not fade—it transforms, living on through memory and legacy.

As we reflect on the ups and downs of this season’s kicking performances, one thing becomes clear: while individual struggles can capture attention, the overall trajectory of the position remains one of incremental progress. This is particularly evident in the continued improvement on long-distance kicks, where accuracy rates once thought unattainable have then become the norm. If this trend persists, a successful 70-yard field goal feels increasingly within reach. However, it also seems increasingly unlikely that Justin Tucker will be the one to achieve it.
If you enjoyed this article, feel free to follow me on Twitter for more analysis and insights: @jakegrossman0.
