I wanted to make this flow chart for two reasons:
- I realized I’ve actually never made a flow chart before and wanted to make one just to cross something off of my bucket list.
- I wanted to see when NFL teams should be passing and when they should be running.
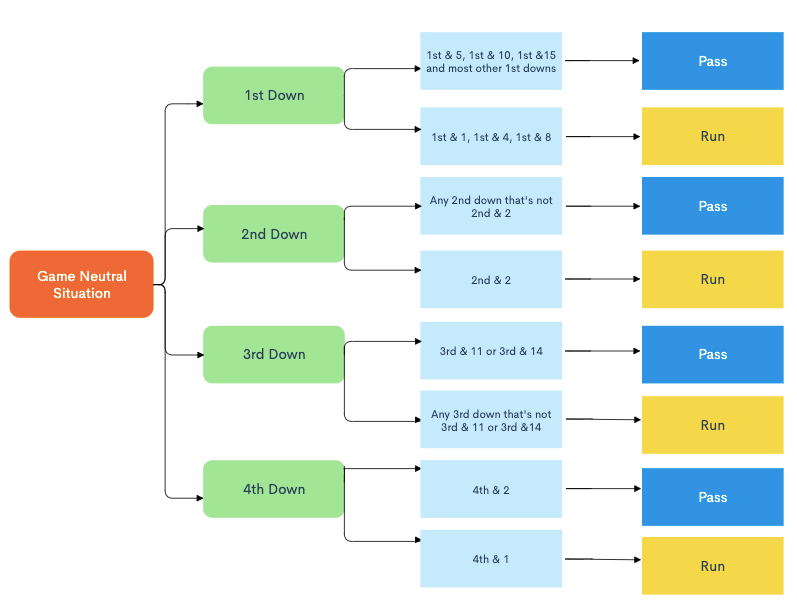
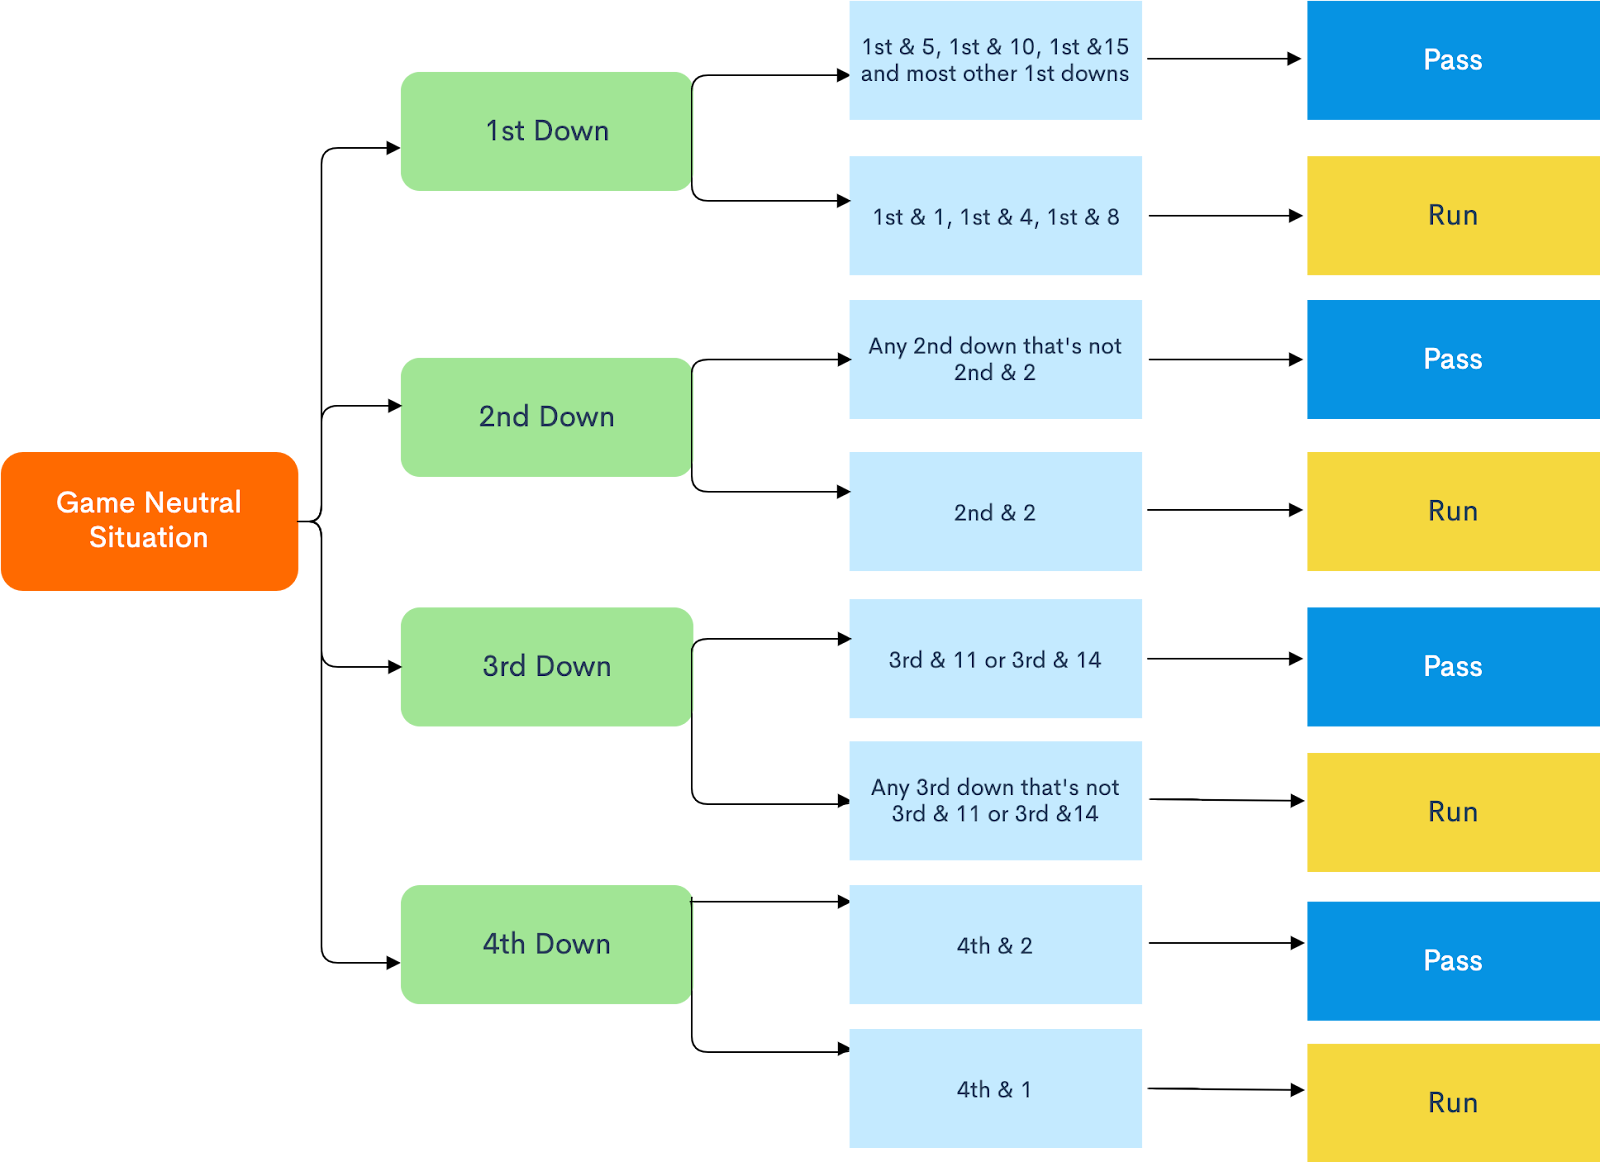
Now, this chart isn’t the end-all, be-all and should be adjusted for yard line, a team’s strengths and weaknesses, time remaining in the game, and a myriad of other factors. However, in a game neutral situation where the win probability is between 20% and 80% and the game is outside of the two-minute warning, I think it is a good way to plan out play-calling based on down and distance. I’m not fully convinced that teams should run on almost every 3rd down but throughout this article, I will explain how I arrived at that conclusion. I used three advanced statistics to develop my model:
Expected Points Added (EPA)- The one play change in expected points from each yard line based on down and distance. A 1st & 10 at a team’s own 25 gives the team an expected points of 0.90. A 6 yard gain to make it 2nd & 4 gives the team a new expected points of 1.09 points so that singular play added 0.19 points.
Success Rate- How often chunk plays occurs. A successful play is getting 40% of the yards needed on 1st down, 60% of the yards needed on 2nd down, and all of the yards needed on 3rd and 4th down.
Win Probability Added- How a single play affects a team’s win probability.
I analyzed over 100,000 NFL plays from the last five years by filtering out the last two minutes of each half and garbage time. Out of those plays, 43.9% of them were first downs and 1st & 10 occurred the most often with 43,000 total plays (1st & 10’s usually happen multiple times a drive while 1st & 5’s and 1st & 15’s happen sometimes. Most 1st & 1’s and 1st & 2’s happen near at the goal line).
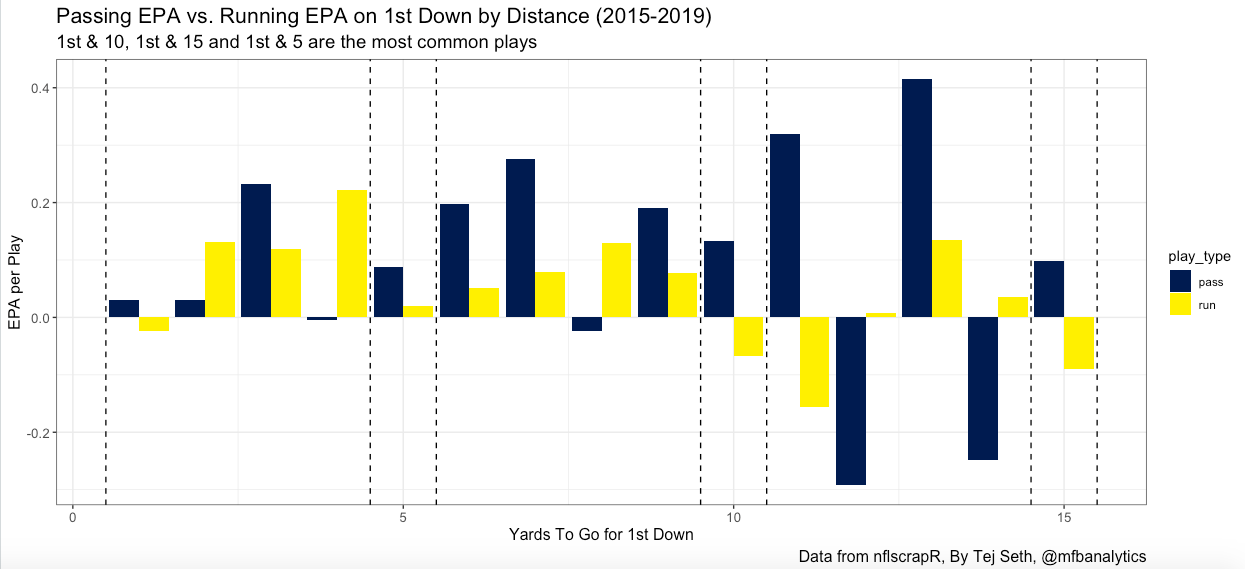
Since 1st & 10’s account for 40% of all football plays, teams should really consider the magnitude their play-calling has on those plays. If teams were to pass instead of running on more 1st & 10’s, they could improve in almost every statistic:
| EPA Per Play | Success Rate | Yards Gained | WPA | Usage | |
| Passing | 0.13 | 50.0% | 7.50 | 0.00 | 45.5% |
| Running | -0.07 | 33.5% | 4.53 | -0.01 | 54.5% |
1st & 15’s and 1st & 5’s, which happen because of false starts or offsides penalties, also both show passing has a much higher EPA than running in those situations. Calling for more passing on 1st & 10 means that there will be more 2nd & 10’s because of incomplete passes. Old-school intuition tells us to run in these situations to set up a more manageable third down but that’s actually wrong. Running on 2nd & 10 is similar to the people investing in toilet paper at the beginning of the pandemic: they were doing it to provide extra security for themselves but didn’t realize it was actually benefiting nobody.
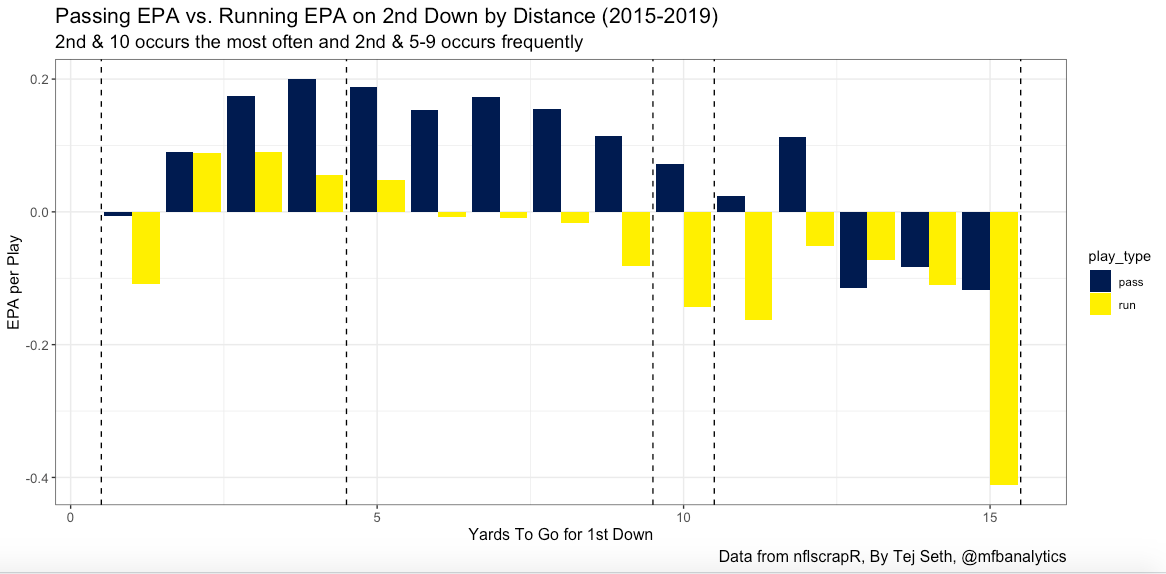
On 2nd & 10, the most frequently occurring of all 2nd downs, passing had a much higher EPA than running along with also having an extra 1.5 yards gained. The most drastic difference between passing and running EPA was on 2nd & 15 as it seems like the worst thing you can do to your offense is to run on 2nd & 15 as running only gains an average of 4 yards and will leave you with a long 3rd & 11 to convert. Every type of 2nd down, except 2nd & 2 for some reason, showed a steep drop-off in passing compared to running.
Passing has dominated so far so I’m sure 3rd downs will show similar results and this will just turn into another analytical article telling teams to pass more:
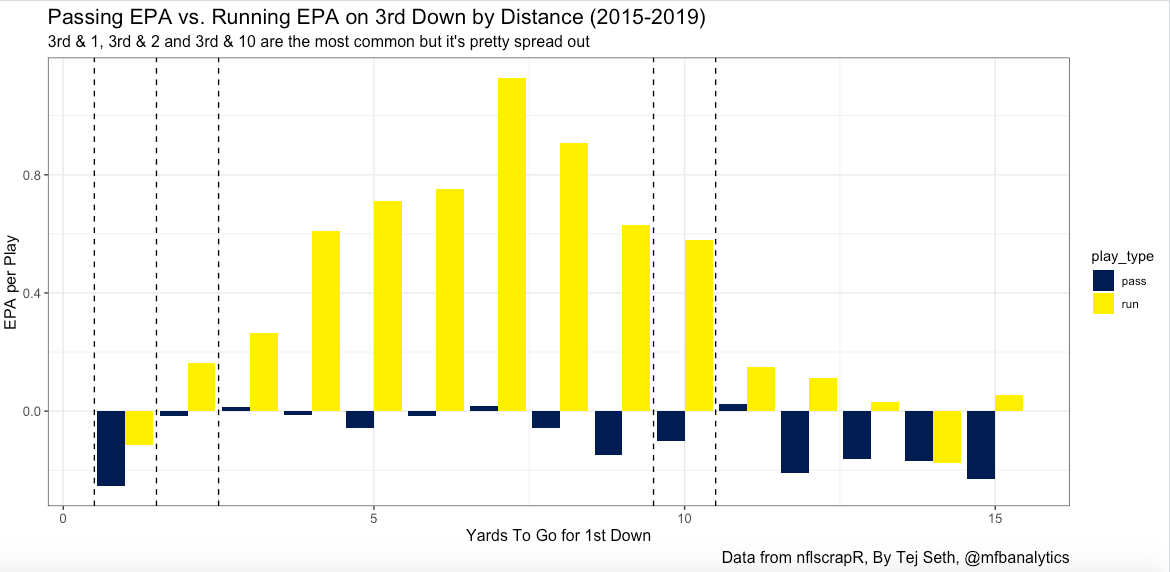
Wait what? That can’t be right. How does passing almost always have a negative EPA on 3rd down while running has some very high positive EPA’s? Maybe it’s because passes thrown on 3rd downs are more desperate and that leads to a higher incompletion rate? Or maybe it’s because runs aren’t actually getting the 1st down but getting just close enough to generate a positive EPA. Let’s look at success rates:
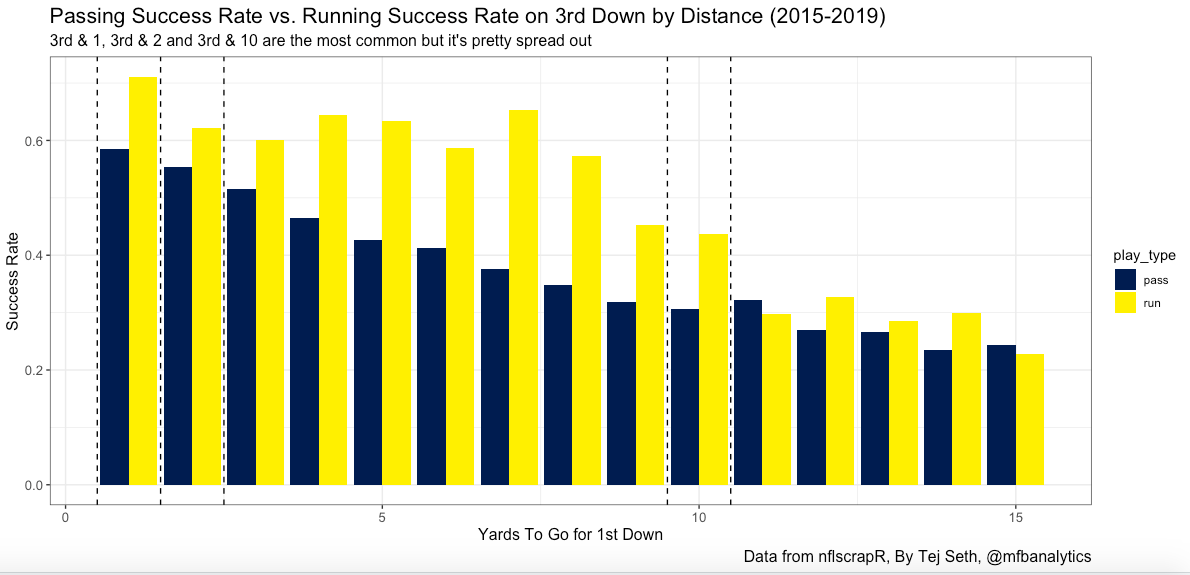
Running on let’s say 3rd & 7 gives you a 28% higher chance to convert the first down. In fact, rushing success rate is higher than the passing success rate in every single distance. Maybe if we look at win probability added something will change?
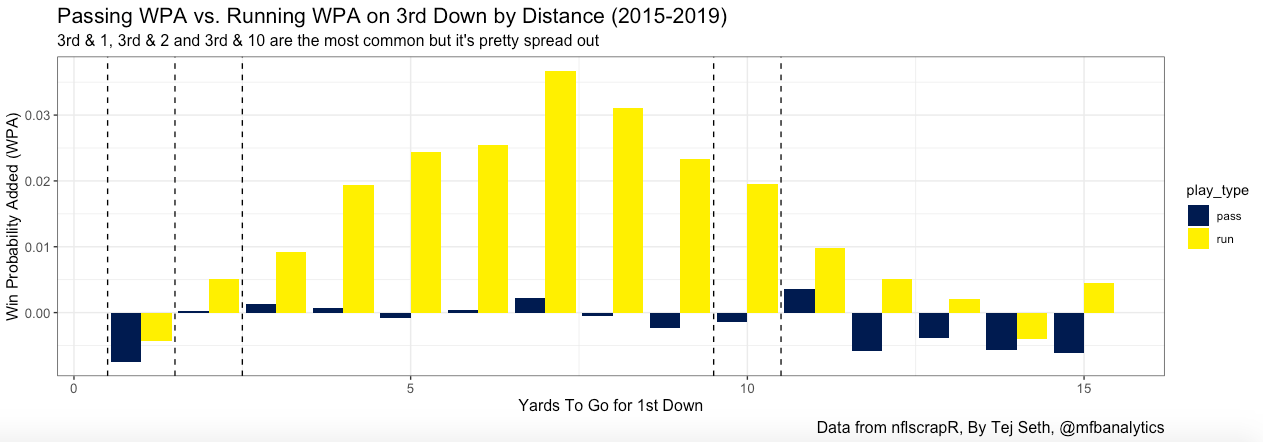
Nope… A run on 3rd & 6 can add almost 4% more to your chances of winning a football game than a pass. For one final chance for passing to redeem itself, let’s see how many yards passing and running gains relative to how far away the 1st down markers are:
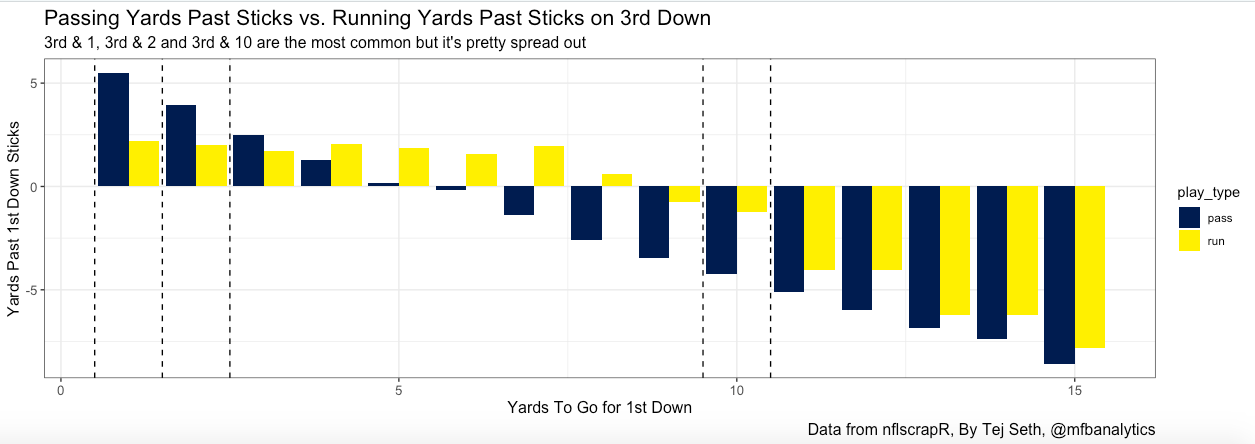
Overall, passing on 3rd & 1, 3rd & 2, and 3rd & 3 will give a team more yards total but because of how big of a swing it is to have an incomplete pass and be stuck with a 4th down, running seems to generally be the better option there. Also, teams that have been gutsy enough to run on 3rd & 6, 3rd & 7, and 3rd & 8 have generally been rewarded by gaining the first down and more (Maybe Freddie Kitchens wasn’t so crazy when he ran a draw play on 4th & 9: https://www.youtube.com/watch?v=E6cedHzzwhc).
Another reason I think it’s possible runs have shown to be much better than passes on 3rd downs is because of how infrequently they happen. Teams pass in 3rd & 5 or longer 94% of the time. Due to the small sample size and the once-in-a-blue-moon run on 3rd and long that catches a defense off-guard, that might be a huge factor in this analysis. It’s pretty plausible if a team were to run frequently on 3rd and long, it would be sniffed out and wouldn’t be as successful as these charts have shown. I am not going to full advocate for more running on 3rd and long until more research can be done.
Although you could make a case that 3rd downs are the most important, they don’t occur that often and passing still reigns supreme in the top ten most common down and distance occurrences:
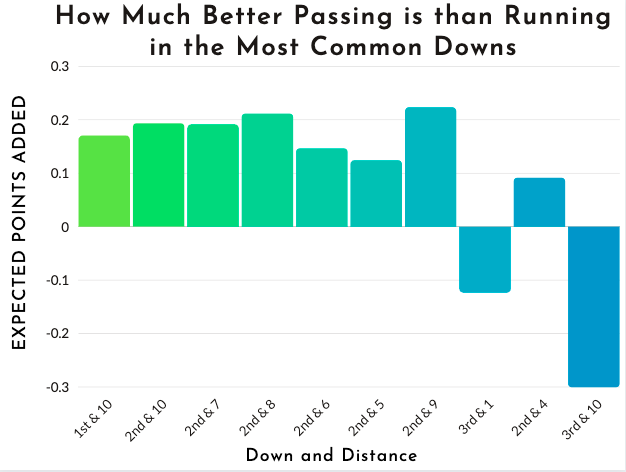
Passing is the better option by a wide margin for 8 of the top 10 while running is slightly better on 3rd & 1 and significantly better on 3rd & 10.
From this data, I have developed some heat maps and cheat sheets that I would carry around if I was a coach of an NFL football team. (I would also demand my NFL team to have a marching band and Chick-Fil-A on the sidelines so I am probably not best suited to be an NFL head coach):

I like this heatmap a lot because wherever there is gray (like on 2nd & 7), it tells me that those plays rarely generate positive EPA and to stay away from them. I can also see the darkness of the green to pick between a pass on a run. For example, on 2nd & 3, both have a positive EPA but passing looks to be the slightly better option.
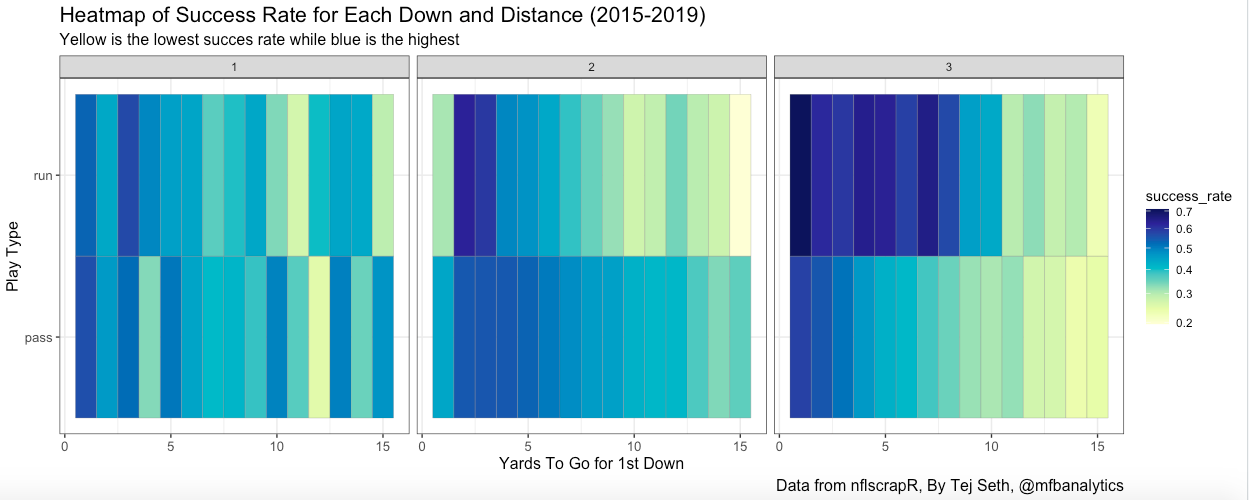
We can also look at a success rate heatmap to keep my offense on track. Passing on 2nd downs at the bottom seems to be dark blue while running on 3rd downs at the top has the darkest of blues. The final chart I would carry around with me is a little table telling me what to do based on down and distance if I was stuck (some areas didn’t meet the sample size requirement and are empty):
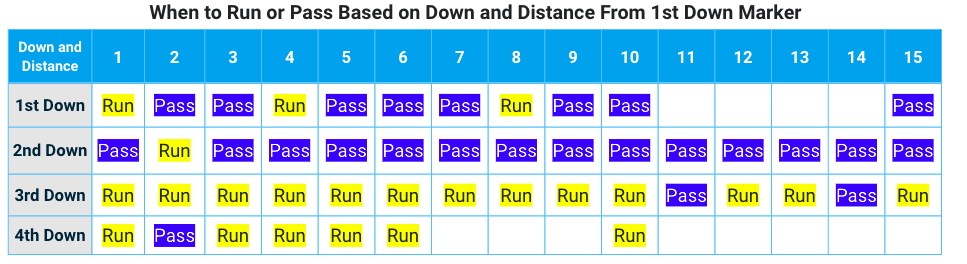
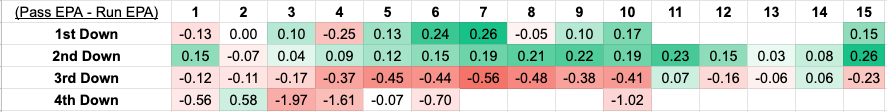
To be short: Pass on most early downs and if you’re desperate, run on 3rd down until the defense catches on. We can look at that same table by seeing how much better pass EPA is than run EPA at each down and distance:
Since I’ve exhausted it enough with far too many blue and yellow charts, it’s time to look at good at calling passes and runs when they should be calling them.
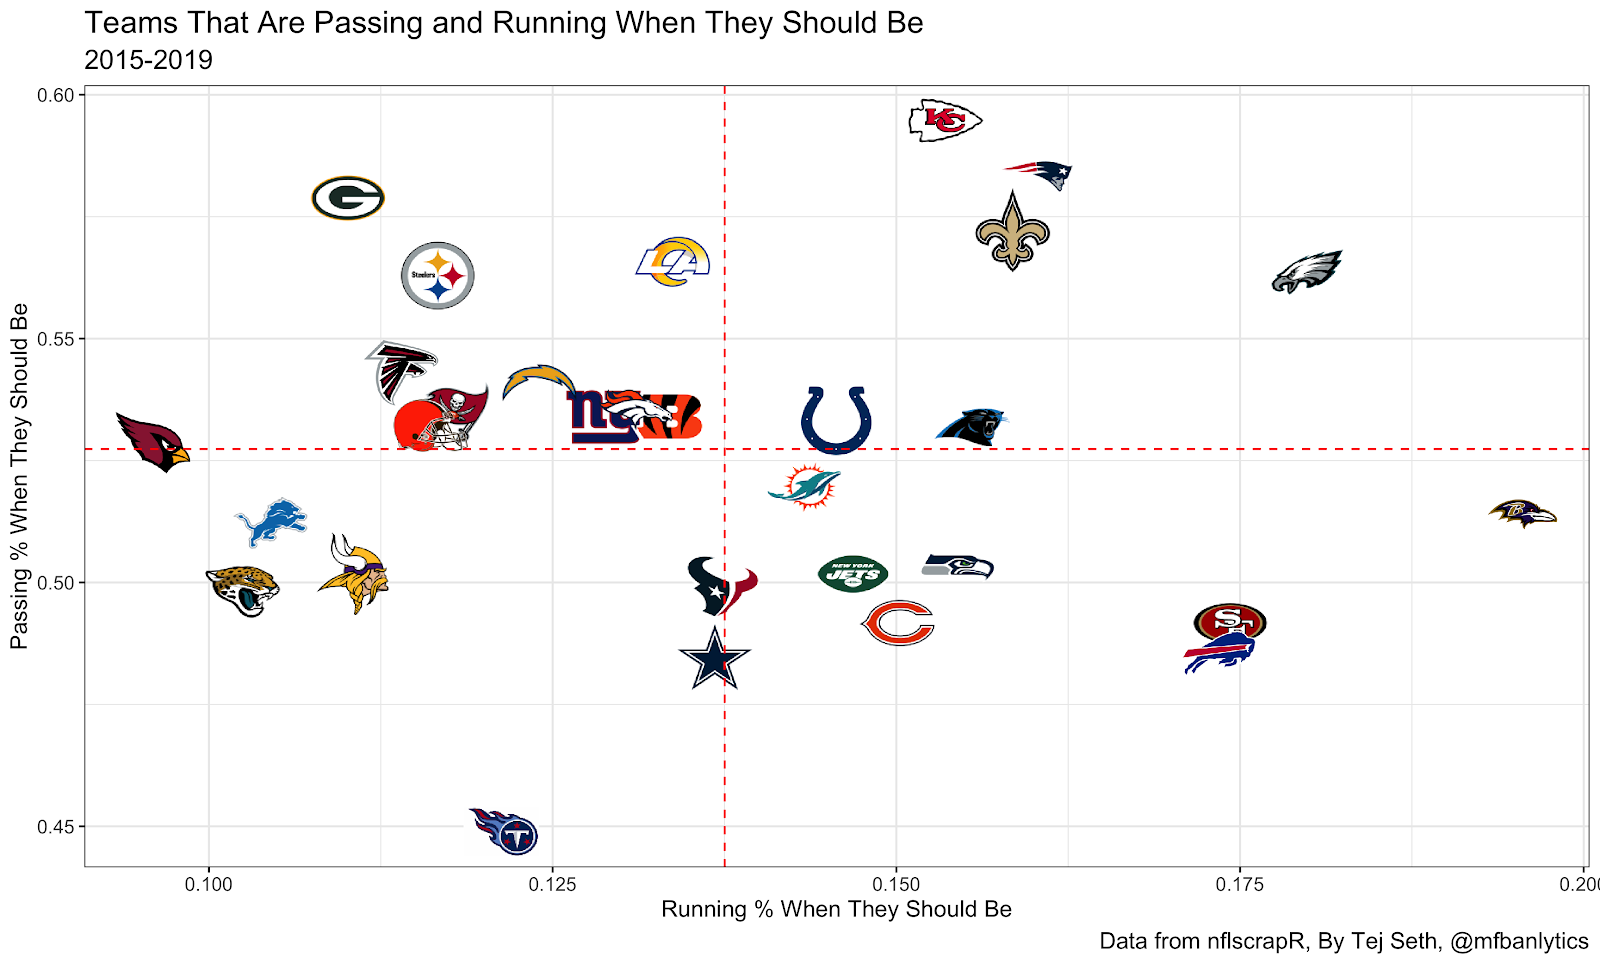
- It’s no surprise to see teams that have been great for the last five years like the Chiefs, Patriots, Saints, and Eagles all at the top right of this graph.
- It’s also no surprise that the Seahawks didn’t #LetRussCook and only pass 50% of the time when they should be.
- It seems like the Texans and Cowboys should put more trust into their quarterbacks and let them pass more often.
- Frequent playoff teams like the Packers, Steelers, and Rams are really good at passing when they should but not as good at running when they should. The 49ers, Bills, and Ravens are the opposite.
If we look at teams making the right play-calls compared to their offensive EPA/play in 2019, we can see a slight correlation:
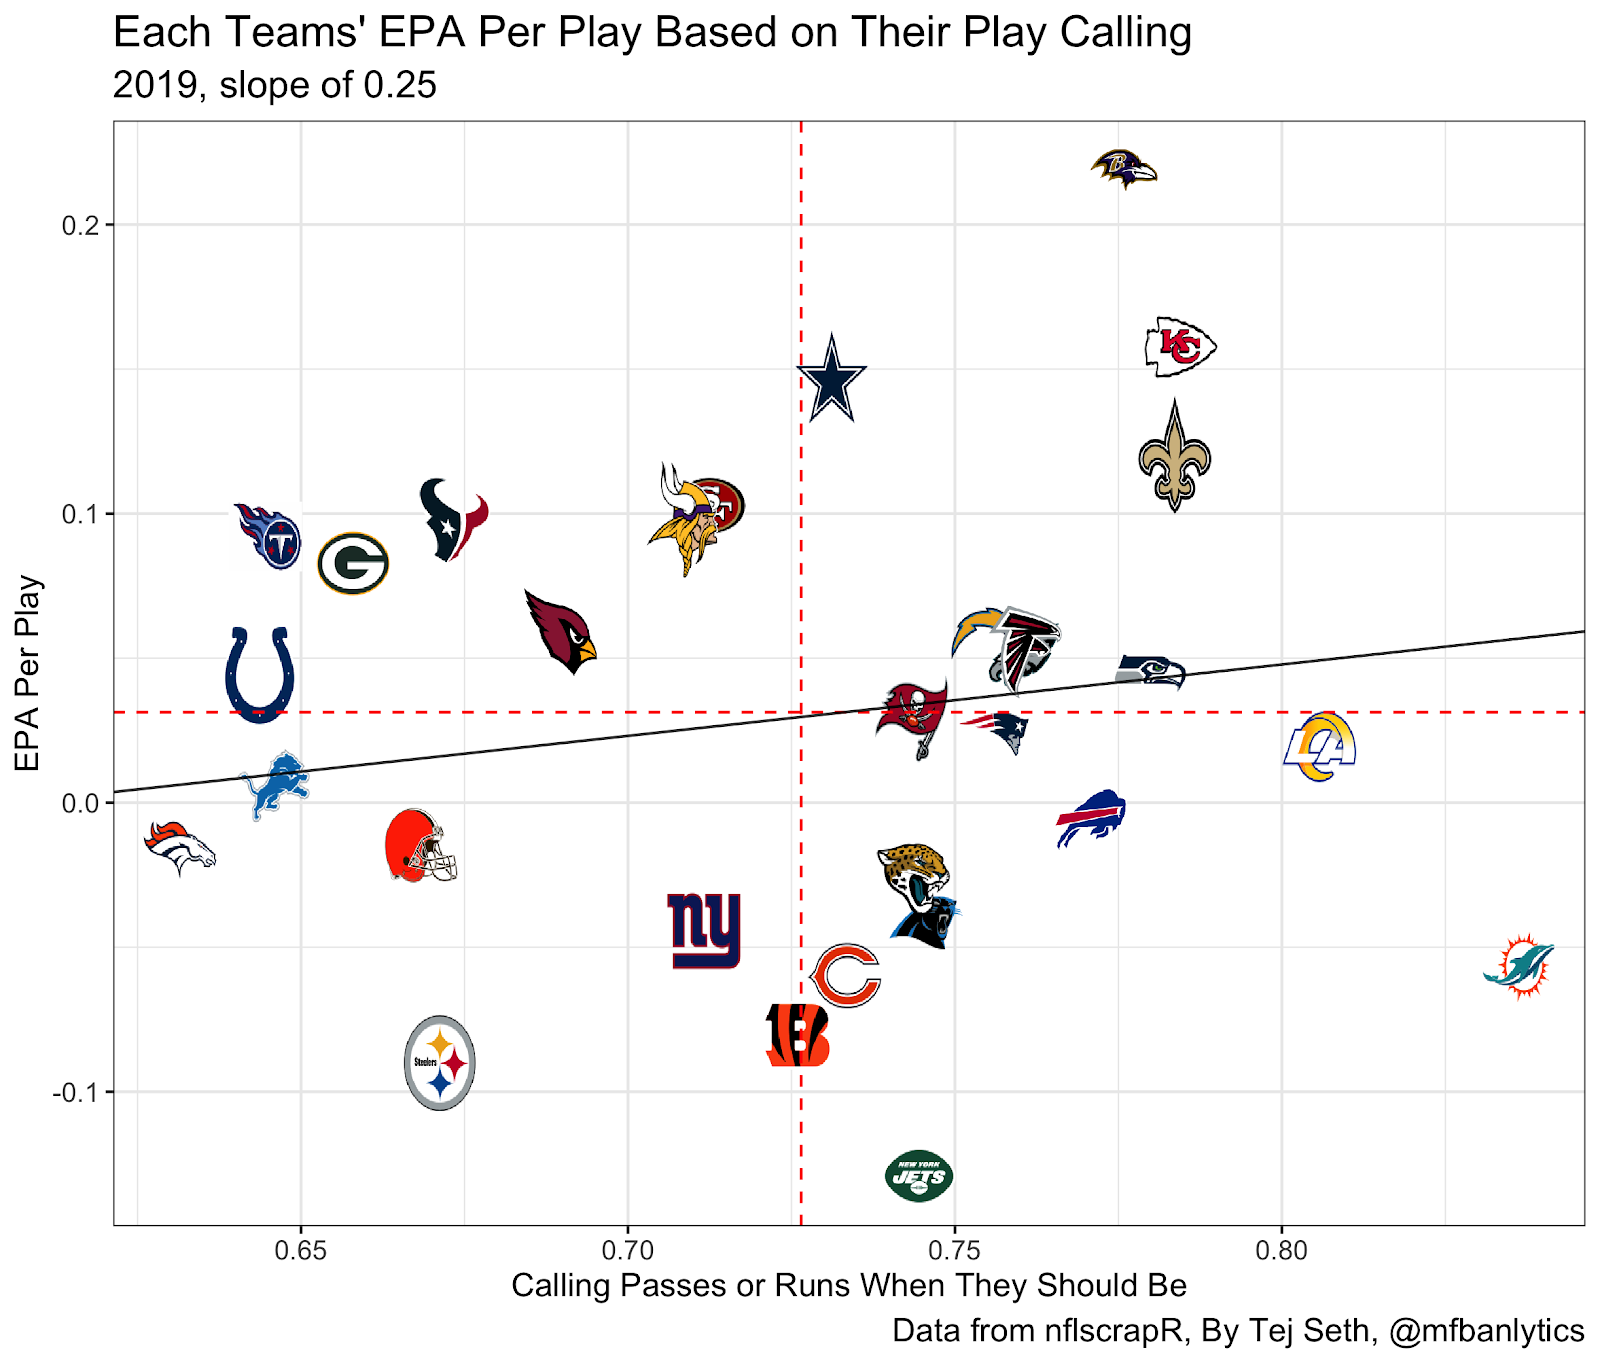
- Look at the Dolphins as the NFL’s best play-calling team!
- 7 of the 12 playoff teams in 2019 called the right plays at a better rate than the average NFL team. The Titans, Packers, Texans, Vikings, and 49ers were the ones that didn’t, although the Vikings and 49ers were close.
- Like I said earlier my chart can’t be the end-all, be-all as a lot of it depends on specific teams. For example, the Lions and Steelers were playing with backup or 3rd string quarterbacks for a good portion of the year and their coaches didn’t feel comfortable letting them pass frequently on early downs.
- Maybe Adam Gase isn’t so bad after all for the Jets?
I talked to Colts Football Strategy and Research Analyst, John Park, about these findings. He mentioned something to look at would be if teams with better quarterbacks passed for often on early downs and if that inflated the numbers for passing on 1st and 2nd down. Although he had a good point about correlation, not causation, out of the top 10 teams that passed on early downs, 7 of had quarterbacks that didn’t rank highly in the Dolphins, Rams, Cardinals, Bears, Buccaneers, Giants, and Bills.
In conclusion, NFL teams are already doing a pretty good job at calling passes and runs as they are hitting at a 72.5% rate. All I’m suggesting is for that rate to take around a 10% jump, mainly with more passing on 1st & 10 and 2nd & 7-10. It would be just like how my grades took a jump once my classes moved from in-person to online in the Spring of 2020. The 3rd down results are still skewed because of how infrequent runs are on 3rd downs so the jury is still out there in that regard. But hey, if an NFL coach feels so good about their job security that they’re willing to run it on 3rd & 8 and risk getting booed out of the stadium, they do deserve the first down.
